Creating a plausible future history is such a daunting task that most SF authors don't even bother to try. The future history page suggests many rules-of-thumb and shortcuts, but it is still a lot of work. Wouldn't it be nice if one could automate the process?
This is an area which has not been explored in any detail, but is not totally without any trailblazers. Who knows? You might be the one to make a real contribution in this field. A computer spread-sheet that calculates graphs plotting historical trends would be a major help. But the ultimate tool would be some sort of computer program that is an SF Future History Generator.
I gave a very simplistic example of modeling future history on this page.
Simulation
There is a more complicated but more entertaining way to create a future history: Simulation. This is not strictly automation, but it is easier to just making everything up.
Role Play
There was a (sadly defunct) game company called Game Designer's Workshop. For their hard-SF role playing game 2300 AD, they needed a future history. So they simulated it with a game, the so-called "Great Game." A team of expert players was each assigned one nation and the game was played until the time reached 2300 AD. The events that occurred were recorded, and became the future history.
An overview of the rules and the game map can be found here. The actual rules to the game can be found here.
A more cinematic but powerful method is to use the role-playing game Microscope to create your future history time line. With this game, the players generate their history fractally. It is an innovative and surprisingly effective technique. You can read more about how to use it to generate your future history here.
More recently, a gentleman named Steve Walmsley has created a computer based game called Aurora. On the surface it is just another game where players vie to create the largest interstellar empire. But the game's purpose is to provide an environment in which the players can build detailed interstellar empires and write associated fiction.
If you are interested, go to the Aurora forum, register, and you will be allowed into the download forum.
Modeling
John Barnes Model
The best guide to calculating history that I've managed to find is John Barnes' How to Build a Future. Dr. Barnes stated in the essay that his imagination is not up to creating an entire future history from scratch, so he uses spreadsheets to plot trends for inspiration. He goes into great detail about the theory behind the forecasts, but leaves the gathering of hard data to feed into the forecasts as an exercise for the reader. After all, Dr. Barnes does not want to make it easy for any other authors to compete with him.
HOW TO BUILD A FUTURE
…Assuming that interstellar colonization would be a relatively low priority for future civilization (important for prestige or PR, perhaps, but not
truly vital), how long before colony ships would be cheap enough to represent little or no strain on the global budget? That would mark the beginning of a plausible colonization era.
Where physical worldbuilding uses equations, social worldbuilding
generally must use models. A model, technically, is a “system state vector”
(a set of numbers, like population, growth rate, GNP, economic growth,
and per capita income, that characterizes the system at one moment in
time [say 1989]) plus a “transformation rule” for calculating a next vector in the same format (“multiply the growth rate by the population and
add it to population to get new population,” “divide GNP by population
to get per capita income,” etc.). By applying the transformation rule over
and over, you can project a set of values indefinitely into the future.
To do modeling, I usually set up a spreadsheet (a columnar pad, for
the rare Analog reader not yet computer-initiated). Each row is a system
state vector, the values for one time period; each column is a social variable of interest. The cell formulas are the transformation rule. The values of social variables are calculated partly from present-day, and partly
from lagged (previous period, next row up) values of other social variables. You simply record the initial state of the world in the first row, set
up the cell formulas to calculate the next row, and then generate more
rows until you reach the desired year.
Initially I just wanted a quick-and-dirty estimate of the earliest quarter century in which a colony starship might reasonably depart Earth, so
I set up my spreadsheet with one row equal to twenty-five years.
I started forward from 1985 with the following assumptions:
1. The fully loaded ship, exclusive of fuel, masses about 330 million
kg. (60 percent of the size of the biggest present-day oil tankers).
Dividing by 25 percent gives 1.33 billion kg of mass at launch, so
1 billion kg of fuel are required (regardless of destination because the ship travels ballistic most of the time).
2.GWP (gross world product, the annual total value of all production and services worldwide) grows at a conservative 2.5 percent
indefinitely. (This and other unattributed specific numbers are either found, or calculated from values found, in the 1989 World Almanac. There are better and more esoteric sources of numbers, but
you can do just fine with that one simple source.) Working in increments of twenty-five years, that’s about 85 percent per iteration.
3. The starship is a government venture. As Earth continues to industrialize, the public/ private mix, and the growth of the public
sector, will tend to approximate those of the Westem democracies of today.
(If you think that’s a whopper of an assumption, you’re right.
Feel free to play around with drastically different values.)
Right now the average size of total government budget among
Western democracies is about 37.9 percent of GDP (gross domestic product—GNP without foreign trade, to more accurately
reflect the actual size of a national economy) and the public sector claims an additional 7 percent per twenty-five years (Heidenheimer, Heclo, and Adams, page 173). We might simply figure a
future date at which the government budget becomes 100 percent of GWP, but I chose to assume that the private sector is actually losing 10 percent share per twenty-five years. Thus the
private sector dwindles but does not disappear (in fact it continues to grow in absolute terms—just more slowly than government.)
4. The first colonizing starships will be built when one of them represents one half of one percent of five years of global government
budgets. Modern nations rarely pursue non-vital projects of
more than five years’ duration, and one half of one percent of total government budget is about two-thirds the proportion of all
federal, state, and local outlays going to NASA, and thus a conservative estimate of what the future civilization might find a sustainable funding level.
5. Fuel is the cost bottleneck. (A century or more of unmanned or
small-crew exploration has developed the necessary technology.)
This seems especially credible because the fuel converts to five
million times present American annual energy production.
6. The price of energy remains constant. Energy price automatically
sets a boundary on fuel price because the price of any fuel must lie
between the price of the energy it will yield, and the price of the energy it takes to obtain it—below that range, none will be made;
above, it will be too valuable to burn. I assumed starship fuel (antimatter or balonium) could be produced from electricity with perfect conversion, so it cost exactly what electricity did—good
enough for the one-digit-or-so accuracy needed. For greater precision, I’d have had to specify a fuel-to-energy conversion efficiency
and an energy consumption per unit fuel made, and calculated
prices based on those.
Given a starship budget and a price of fuel, I just put a column for
"starships per year” (annual starship budget divided by the price of one
billion kg of fuel) on the modeling spreadsheet, and scanned down the
sheet to see where it exceeded .2; that date plus five years would be a
good figure for the first launch.
Unfortunately, with energy prices at present levels, launch year came
to 3165. From past experience, that’s much too far into the future to
model at all, not to mention being extremely discouraging.
To get out of that situation, I added more balonium to the technology mix. I came up with the “Von Neumann powersat” of “VNP”—a
space-borne electric power plant that puts out fifty trillion watts and
reproduces itself every eight years. Whether VNPs are solar, nuclear, antimatter generators, or balonium transformers didn’t matter to me any
more than it usually matters to a mainstream author whether the electric
power in his fictional house comes from hydro or coal. If it were relevant
to the story, I’d simply work up some specific physical rationale to fit
those economic parameters.
So this gave me a new Assumption 6, to replace the one above:
6. Sometimes in the early 2000s the first VNP is constructed; within
a few decades, their rapidly growing population is virtually the
whole electric production for the solar system.
VNPS increase about eightfold every quarter century. GWP increases
1.85-fold in the same time. Demand for electricity is roughly a function
of the square of national GDP, so presumably that means demand is going up (1.85)2 = 3.24 fold per quarter century at the same time supply is
increasing eightfold.
In the very long run—and in twenty-five years you can modify machines, homes, practically anything—you can use an almost infinite
amount of electricity if it’s cheap enough. Assuming society holds
growth in its electric bill at the same proportion of total expenditures,
then, every twenty-five years the planet is buying 8 times as much electricity for 3.24 times as much money. Or, to the one digit of accuracy we needed, the VNP causes price of
electricity to halve every twenty-five years.
Under the new assumptions 2285 began the quarter century in which
launching was feasible. Humankind’s first interstellar colony would be
launched in 2290.
Three centuries is still a very long way into the future—think back to
1690—and that’s just the beginning of the colonization era. Since the
idea I started out to work on pretty much demands that other solar systems have been colonized for some centuries, it takes a while to build
and launch hundreds of starships, and it might take as much as eighty-five years travel time to some of the colonies, the date of the story is still
further away from the present than any reasonable ability to extrapolate.
(My experienced-based general rule is that five hundred years is the
absolute maximum.)
I didn’t want the world to get utterly unrecognizable (though that
might make another good story), but clearly I would need a reason why it wasn't unrecognizable. I decided to add an event to the background: at or
around the time the colony ships are leaving, for some reason or other, the
global human culture decides change in general is bad, and begins the Inward Turn (a period like the Enlightenment or Renaissance). There will
be much refinement but little new development after A.D. 2300.
Such things have happened. The familiar case is Tokugawa Japan, but
China, Persia, and India have done similar things at times, and the tendency was clearly there in other cultures (e. g., Dark Ages Ireland, fourth
century Rome). So it’s a reasonable human possibility.
CYCLING FORWARD
…What triggers the Inward Turn? We need to have some major event happen three hundred years from now, give or take fifty. What could it be?
If I already had a clear picture of the society of 2285, I might simply
make up a shock to impose. Since I don’t, I’ll develop the society first.
Because good social models tend to be unstable, there may be a big
enough shock occurring “naturally” near the desired date.
For this projection, I calculated annual values of the social variables,
giving a more elaborate fine structure, because the social event I was
looking for would lie somewhere in the rich detail of history. I’ll discuss
only the seven variables that gave me a result I would use for the story,
but I actually modeled more than forty variables. (Like photographers,
modelers have to shoot a lot more pictures than they keep.)
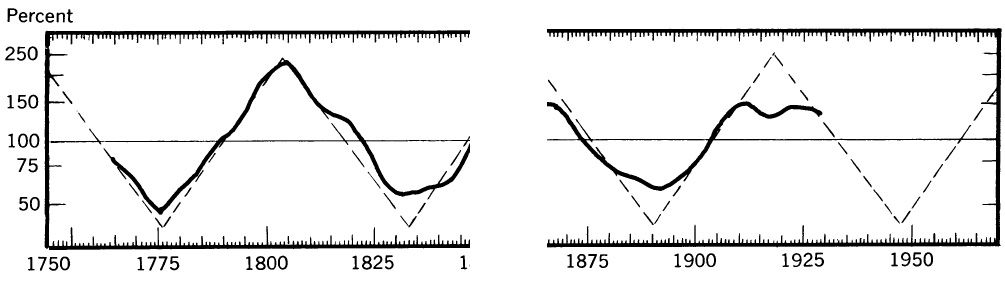
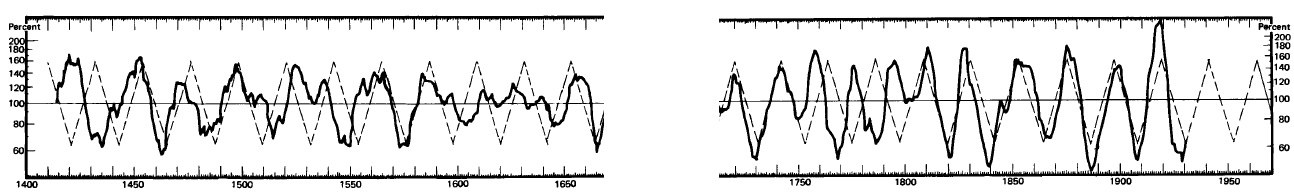
We’ll start with the economy, taking Woodward and Bernstein’s advice—as good in the social sciences as it is in investigative journalism—to “follow the money.” It also happens to be a good example of cyclic
phenomena.
There are cycles in the rate of growth, not in the actual size of the
economy itself. You can take growth of GWP as varying from 1 percent
to about 6 percent annually (postwar values for industrial nations except
for peculiar cases like japan and Germany during postwar reconstruction) with the average at around 3.8 percent; or, taking data going much
further back in history, you can assume annual economic growth can
fluctuate between -3 percent and +9 percent, with an average of around
2.7 percent. I chose the smaller range.
The effect of each cycle is about 1.8 times as large as the effect of the
next shortest—thus the Hansen 1 is 1.8 times as big, the Kuzents 1.82 =3.24 times as big, and the Kondratiev 1.83 = 5.83 times as big as the Hansen 2. (these are called "coefficients")
I usually just use a sine wave with a period equal to the length of the
cycle.
First pick a year when the cycle “troughed”—went through a minimum. The year 1795 seems to have been the last four-cycle trough, but
all cycles except the Kondratiev seem” to “reset” during very deep depressions, so you might arbitrarily pick three years during the 1930s for
the Kuznets and Hansen troughs.
The trough will be one quarter cycle before the start of a new cycle,
so you add one quarter of the period to that year, and now you have the
zero year for that cycle (e.g., Kondratiev trough at 1795, period is 54 yrs, so zero year is 1795 + (54/4) = 1808.5).
For the economic cycles (of a newly colonized planet, not Terra), I suggest (instead) starting the Kondratiev wave with
its minimum value on the landing date, the Kuznets cycle whenever you
think they’d start putting up buildings, the Hansen 1 cycle at the point
where they’d be setting up factories, and the Hansen 2 cycle whenever
they’d start making their own goods rather than living on what came in
the ship, because the three shorter cycles are traditionally identified with
building(infrastructural investment), physical capital(fixed investment), and inventory investment(inventory, e.g. pork cycle). (Kondratiev wave is identified with technological basis)(don't forget to add a quarter of a cycle)
For the value of each of the four cycles at all future dates,
then:
Cycle_value = sin ((Current_date - zero_year) / (Period / 2π))
(ed note: Basically the equation is generating a sine wave with a cycle time equal to Period. So Period is 54 years for Kondratiev, 18.3 for Kuznets and so on. zero_year is the year zero for that cycle: 1808.5 for Kondratiev, etc.
Here the sin(x) function is expecting "x" to be in radians, as most spreadsheets and computer programming languages do. That's why the period is divided by 2π, the number of radians in a circle. If your sin(x) uses degrees, you'd divide by 360 which is the number of degrees in a circle.)
Total_cycle_value = sum of all four cycle_values times their respective coefficient (those
powers of 1.8) (e.g., mutiply Kondratiev cycle_value by 5.83, Kuznets cycle_value by 3.24, etc.)
Growth = average_growth + k(total_cycle_value), where k is a normalizing constant, a simple fudge factor to make the results come out within
the range of growth you’ve selected.
The value of GWP in year Y is then simply:
GWPY = GWPY-1 * (1 + growth_rate)
(ed note: where GWPY is value of GWP in year Y and GWPY-1 is value of GWP in previous year)
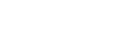
Figure 1: Annual growth and GWP to the beginning of the Inward Turn
As you can see in figure 1, in the next three centuries the growth rate
flexes all over the place, but in the long run of history what we see is simply the same explosive growth that has characterized the last century or
so. By the time of the Inward Turn, everyone is a lot richer. But what is
available for them to buy?
HALF MAGIC
I need not tell an SF audience that technological advance has dramatic
effects. There are a lot of different ways to model it; this time I used the
“shopping list” approach—gadgets are invented at a steady rate, but
they are economically deployed (that is, come into actual widespread
use) in bursts. Schumpeter suggested deployment might correlate with
the upswing in the Kondratiev wave; it’s also a truism that war brings
rapid technical development.
To express this, I simply assume significant new inventions go onto a
“shopping list” or “technological backlog” of potential technology, and
move off the list and into real deployment at a rate that varies between 0
and 100 percent, depending on the Kondratiev cycle value and the values of warfare indicators (see below).
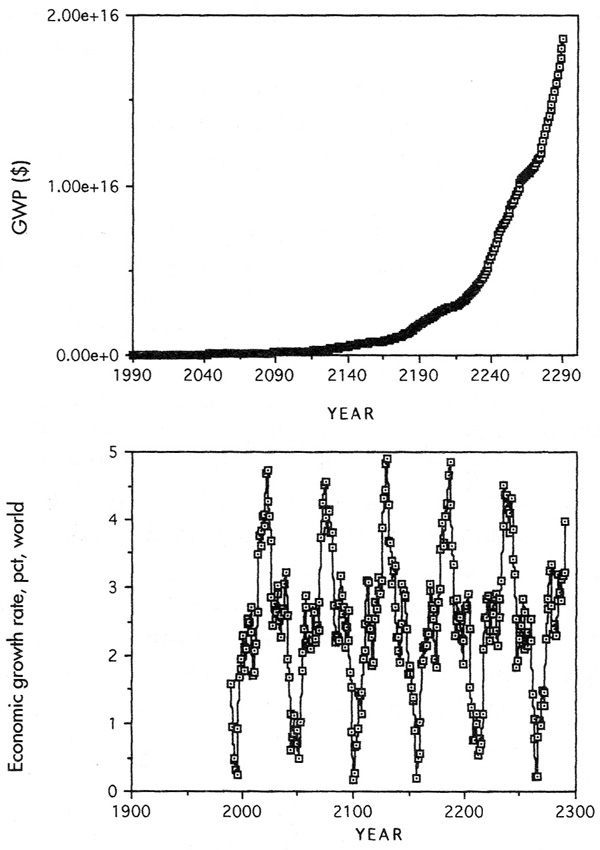
Figure 2: Technology deployment (index of number of major innovations)
annually 1990-2290.
As you can see in figure 2, this gives a fairly credible situation: technology sometimes stagnates as nothing new is deployed for a long time,
and at other times skyrockets, especially after a long hiatus. This gave
me as much information as I really wanted: eight major surges of technological innovation between now and the beginning of interstellar colonization. (A “major surge” is something on the order of the highly
innovative periods 1900-20 or 1940-65.)
To envision the surges, I use a general rule that has no justification
other than gut feeling. Each new surge is 90 percent what you might
have expected from the last one, plus 10 percent magic (in its Clarke’s
Law sense). So from the viewpoint of 1920, 90 percent of the gadgets of
the (roughly) Manhattan Project through Apollo Project boom would
be imaginable (indeed, some, like TV, were abortively available in the
previous boom). But 10 percent (lasers, nuclear power, transistors)
would be absolutely incomprehensible—magic.
I further arbitrarily assume that the major discoveries for the next
surge have all been made as of today.
The graph shows a major surge in the 2000s and 2010s, Surge Zero,
which should deploy everything in SF that seems pretty likely right now.
Everything.
Does that feel like a real explosion in the brain, like Bruce Sterling or
William Gibson at their dazzling best? All the same it’s only the start.
Surge One must be an immense extension of everything in Surge
Zero, plus a 10 percent addition of things that work according to as-yet-undiscovered principles. Surge Two must be extensions on everything in
Surge One (including the 10 percent of magic) plus 10 percent new
magic. From our viewpoint it’s now 19 percent magic.
And Surge Three … well, you see where this gets to. Since the Inward Turn starts at the end of Surge Seven, 52 percent of significant new
technology in the culture we’re imagining must be stuff we currently
would not find comprehensible.
Realistically, the world should be half magic. Who’d have thought
calculations, the lifeblood of hard SF, could drive us that far into fantasy?
Magic Percentage
Surge
0
1
2
3
4
5
6
7
8
9
10
11
12
13
% Magic
0
10
19
27
34
41
47
52
57
61
65
69
72
75
THREE HUNDRED YEARS OF SEX AND VIOLENCE
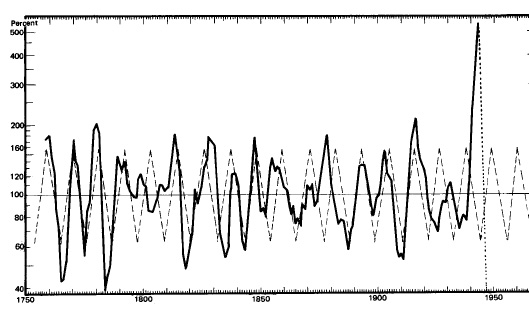
Since we’ve already been through the business of setting up cycles, I’ll
just mention that there are four prominent cycles in the (Wheeler) Index of International Battles, of lengths 142, 57, 22, and 11 years, in battles per year.
(Any separable clash of armed forces between competing sovereignties
is a “battle.”)
142 year cycle
57 year cycle Use horizontal scroll bar to pan the graph. Yes, I know there is a gap in the center, sorry about that.
22.2 year cycle Use horizontal scroll bar to pan the graph. Yes, I know there is a gap in the center, sorry about that.
11.24 year cycle
Lines from top to bottom
142 year cycle
57 year cycle
22.2 year cycle
11.24 year cycle
Synthesis of all cycles
Solid line is actual battle data from Wheeler's Index of International Battles Dotted line is prediction from synthesis of all cycles
The same cycles apply to “battle days per year.” Each day contains as
many “battle days ” as it does battles—so that, for example, if ten distinct battles go on for ten days duration, that’s a hundred battle days.
Like the economic cycles, the longer the cycle the bigger its effect,
but it’s not quite so pronounced, and one-digit accuracy is about as far
as I can comfortably go, so I suggest coefficients of 3, 2, 2, and 1 for
those cycles.
Estimates on actual numbers of battle days per year vary wildly; all
sorts of international, defense, and peace organizations publish estimates, and no two are even remotely close to each other. (The problems
include defining when a battle starts and stops, which incidents are big
enough to be battles, and how separated things must be to be separate
battles.) Thus there’s no good guidance on what the numbers actually
should be.
Once again flying by the seat of my pants, I simply estimated a range.
In all of human history, I doubt there’s been a day of peace—somewhere
on the Earth, two military forces were probably fighting each other on
every day of history. So an absolute minimum would be four hundred
battle days per year (one-digit accuracy, again).
On the maximum side, the most battles probably occurred either
during the nineteenth-century European colonial conquests or during
World War II. There were eight major European colonial powers, and
most of them were fighting one insurrection or another most of the time.
Add in the American Indian wars, and assume the larger British and
French empires were usually fighting two insurrections at once, and you
get eleven battle days/day.
In World War II, counting four Allied fronts against Japan and five
against Germany/Italy, plus partisan activities in occupied areas, and
counting each front as a battle day every day, we get eleven battle
days/day.
Either way it comes to about four thousand battle days per year,
which is obligingly one order of magnitude greater.
After about 1900, the percentage of global population killed in war
per annum is an exponential function of the number of battle days.
(This is just something I’ve found in playing with UN and various other
statistics. It’s purely do-it-yourself social science and comes with no institutional pedigrees, so if you don’t like it please feel free to cook up
your own.)
Again, I set this up as a function that would flex between a minimum
and a maximum. According to UN figures, in a very good year only
about 1 in 100,000 people worldwide die of something directly war-related.
About the highest figure I can conceive (excluding genuine nuclear
wars of annihilation so that there will be a future to write about) is that
a twenty-year war might kill half the global population. That’s about an
order of magnitude worse than World War II, which, if you extend to include the Sino-Japanese, Ethiopian, Spanish, and Russo-Finnish wars
leading into it and the many aftershock wars (Greece, Malaya, Korea,
China, Ukraine, Palestine, etc.), killed around 5 percent of the global
population between 1931 and 1952. So the global fatality rate varies between .00001 percent and 3.4 percent per annum, as an exponential
function of battle days.
Wars are allegedly about something or other. We aren’t interested in
every little brushfire conflict, of course, and neither will our descendants
be—when was the last time you heard anyone refer to the War of the Pacific, Queen Anne’s War, or Prussian-Danish War in passing, and expect
you to follow the reference? But the two really heavy periods of fighting
that appear in the three hundred years should have some global significance.
In the theory of international competition, the classification “great
power” comes up frequently. I like a modified version of Kennedy’s definition: a great power is, first, a nation that can, if it has the will, militarily enforce its wishes on any other nation not classified as a great power,
and on credible alliances of non-great powers; and second, a nation that
is able to make conquest by any other great power too painful for the aggressor to contemplate.
If you apply those rules the way I do, there are five great powers in
the world today: the United States, Japan, the Soviet Union, China, and
the European part of the NATO alliance.
Great powers come into being from sustained periods of economic
growth. Major wars against other great powers produce very high death
tolls and economically ruin great powers, busting them back to secondary status, sometimes permanently and often for decades.
The great powers normally get and consume the bulk of the world’s
wealth, so an ambitious secondary power needs a generation—twenty-five years—of fast world growth to rise to great-power status. Success
for one rising power precludes anyone else’s success. There are finitely
many resources, power vacuums, and unclaimed turf in the world, and
the secondary power that gets all or most of them is the one that becomes a great power---while shutting out everyone else, so I also allowed
only one new great power to emerge per decade.
To express the way wars between great powers quickly knock them
down the scale, I assumed that if annual global war deaths exceed 1 percent, twice their WWII value, all the great powers must be involved. I
expressed this as a simple fraction--every time war deaths went over 1
percent, I busted three-eighths of the great powers (to the nearest integer) to secondary status. Thus a three- or four-year war at those historically unprecedented levels is enough to break all the great powers in the
world.
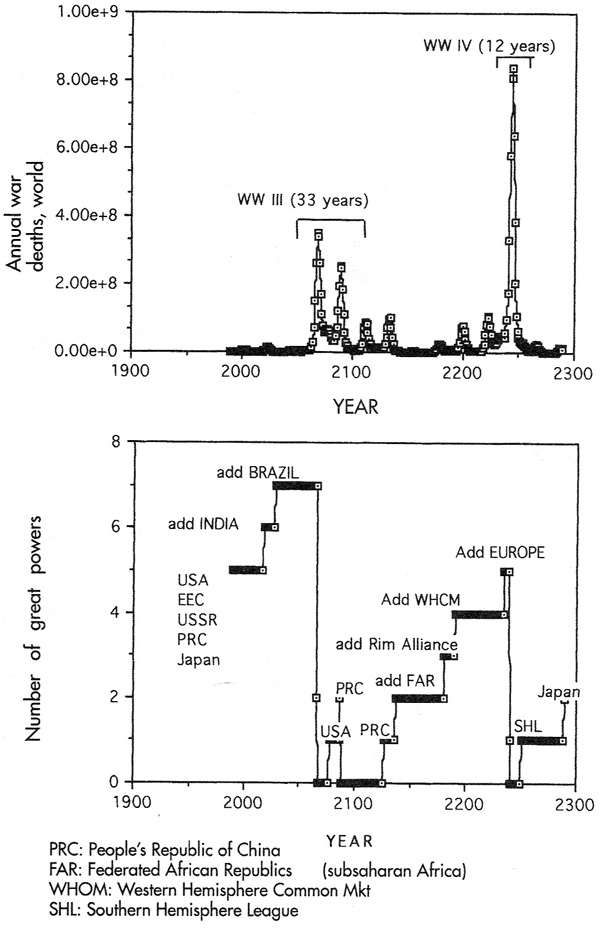
Figure 3: War and the Great Powers to the Inward Turn.
The numbers of great powers, along with war deaths, are shown in
figure 3. There are two truly big wars in this future—World War III and
IV, let us cleverly call them—and the starship launches come right when
a second power manages to lurch up to great powerhood again. Normally that would be time for another war … so why not this time?
Let’s look at population statistics. (This stage of the creative process
approaches sex, like violence, in terms of its quantitative results, rather
than its messy particulars.)
How many people are there in 2290, and where do they live?
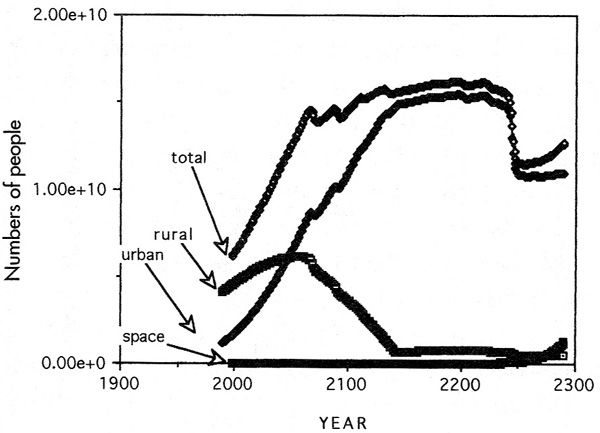
Figure 4: Solar System population, 1990-2290.
The results of the model can be seen in figure 4.
Virtually all the growth of population in the long run comes from
rural populations. This is caused by something that always startles elitists: people are not stupid. Agriculture is labor-intensive, and as long as
an additional person can produce food in excess of its consumption, it
pays to have another baby. (Famines are generally caused by a drastic
change from the expected future—war, drought, or land confiscation
changes the value of children after they’re born.) In most parts of the
world, the expected value of children doesn’t reach zero right out to the
limit of human fertility.
By contrast, life in cities is expensive, and work children can do there
is less valuable, so having kids really doesn’t pay. Thus over the long run
(it takes time to alter perceptions, and peasants who move to the city
don’t suddenly de-acquire children), city dwellers will have children at
or below a replacement rate and rural people will have all they can. “All
they can” globally currently corresponds to a global rural population increase of about 2.3 percent per year.
Luckily, practically everyone would rather live in the city. (The American back-to-the-land fetish is an extreme minority taste.) Currently a bit
under half of one percent of global population moves from country to
city per year. If that continues, by 2056, the growth of rural areas has reversed, and as they decline in population the rate of population growth
slows. In fact, World War IV is so big that global population actually
peaks at around fifteen billion in 2237 and declines to just under eleven
billion by the beginning of the colonization era. Global population is
then more than 95 percent urban (as opposed to 22 percent today).
For a quick extrapolation of spaceborne populations, assume a VNP
makes work for 100 people and the percentage of spaceborne population that would be working in the energy industry declines steadily by 10
percent every twenty-five years. That gives a population growth rate of 6
percent (most of it supplied by immigration at first).
By the beginnings of interstellar colonization, there are 1.256 billion
people living permanently in space. Go ahead and gasp—but it’s a
slower rate than the European population increase in Australia 1788 to
1900, and Australia effectively cost more to get to…
THE TIME OF THE INWARD TURN
…In A.D. 2290, global population is steady at eleven billion, down 27 percent after World War IV, forty-one years ago. Practically everyone lives
in town, and about 17 percent of the population lives in giant high-density towns—the equivalent of twentieth century LA or bigger. Half
the technology is, by twentieth-century standards, magic. Global per
capita income is about 110 times 1985 American per capita income.
World War IV reduced transpoli (freaking huge cities) from seven to five, and hyperpoli (merely huge cities) from
twenty-three to seventeen, well within living memory. There are many
veterans, former refugees, and survivors around, and the ruins of the destroyed hyperpoli and transpoli are still in existence, raw scars visible
even from the cities on the moon, visited by grieving pilgrims as
Auschwitz is today. In the last few years, the hegemony of one super-power has been challenged by the rise of another, and the fear of another
war is in the air.
And that seems to me enough to explain the Inward Turn. At such a
moment a charismatic leader might successfully move for an effective
global sovereignty. The Earth becomes a loose federation, committed to
develop internally, refining and integrating its culture, bringing technical, social, and political change to a near stop, letting humanity find time
to knit together. (Again, that sounds unattractive to us—but we don’t
have four billion dead in a landscape of ruins, and a recent scare that it
might happen again. People whose world was shattered only forty years
ago might feel very differently.)
The paper is about making mathematical models of human societies that predict sustainability or collapse. The latter is of interest to science fiction writers using the popular Decline And Fall Of The Roman Galactic Empirebackground.
First off, the paper examined numerous civilizations in both the old and the new world which collapsed.
Other studies had proposed explanations for each specific case of collapse, including one or more of the following: volcanoes,
earthquakes, droughts, floods, changes in the courses of rivers, soil
degradation (erosion, exhaustion, salinization, etc.), deforestation, climate
change, tribalmigrations, foreign invasions, changes in technology
(such as the introduction of ironworking), changes in the methods or
weapons of warfare (such as the introduction of horse cavalry, armored
infantry, or long swords), changes in trade patterns, depletion of particular
mineral resources (e.g., silver mines), cultural decline and social
decadence, popular uprisings, and civil wars. The paper found these to be a distraction because A) each were specific to a particular case of collapse instead of general causes common to all collapses, and B) many of the civilizations had previously experienced the phenomenon identified as the collapse cause WITHOUT collapsing.
For instance, the Minoan civilization had suffered many earthquakes but simply rebuilt their cities even more splendidly. What was so special about the final earthquake that destroyed their civilization?
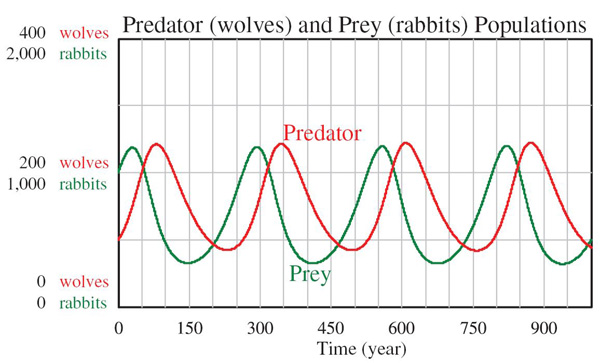
Additionally since civilization collapse in prior cultures is so universal, the causes must be similarly universal. The cause must not be specific to a particular time period, culture, technology, or natural disaster. So they based it on the classic predator-prey model.
HANDY
They call their model HANDY(Human And Nature DYnamics).
The study authors are not saying this is a highly accurate model. What they are saying is this is a simple model or general framework that allows scientist to carry out thought experiments of collapse, and to test changes that would avoid it.
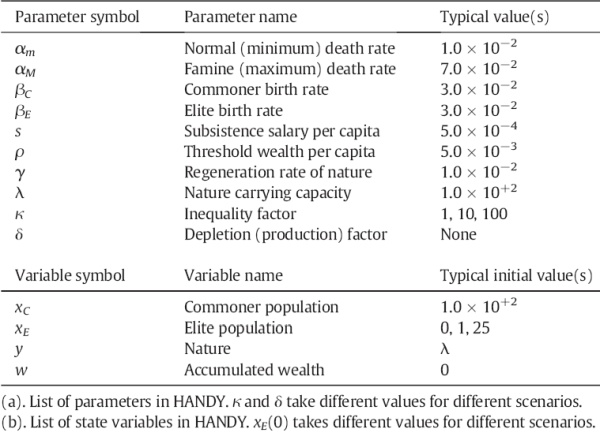
The key parameters are:
the stretching of resources due to the strain placed on the ecological carrying capacity
the economic stratification of society into Elites and Masses (or “Commoners”)
They cite quite a few other papers to justify these two parameters, refer to the actual paper for details.
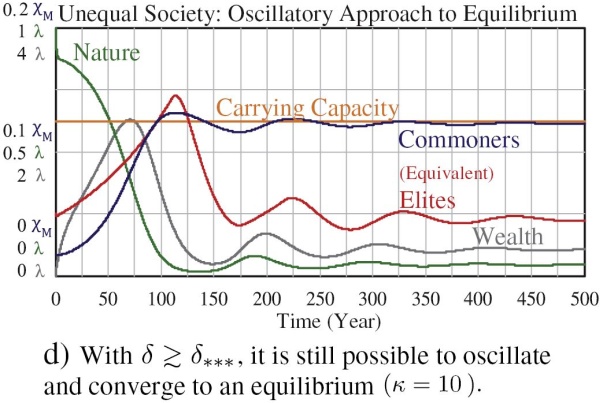
While based on the predator-prey model, the inclusion of two societal classes allows a richer set of dynamic solutions, including cycles of societal and ecological collapse, as well as the possibility of smoothly reaching equilibrium (the ecological carrying
capacity). Carrying Capacity is defined by the study authors as the population level that the resources of a particular environment can sustain over the long term. They call the environment resources “Nature”.
Variables
xC = population of commoners
xE = population of elites
φ = xE/xC = starting ratio of elites to commoners, at beginning of scenario.
s = subsistence salary per captia
κ = factor that elite's salary per capita is bigger than subsistence
y = natural resources or Nature
w = accumulated wealth (surplus resources stored for a rainy day, mostly in the hands of the elites)
ρ = minimum required consumption per capita, below which is starvation
wth = ρxC + κρxE = threshold value for wealth below which famine starts.
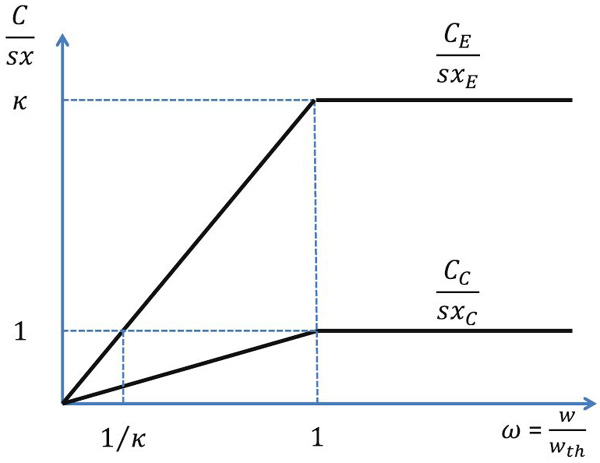
CC = min(1, w/wth)sxC = consumption of the commoners
CE = min(1, w/wth)κsxC = consumption of the elites
βC = birth rate of commoners
βE = birth rate of elites
αm = normal (healthy) death rate
αM = maximum (famine) death rate
αC = αm + max(0, 1-(CC/sxC))(αM - αm) = death rate of commoners
αE = αm + max(0, 1-(CE/sxE))(αM - αm) = death rate of elites
γ = regeneration factor of Nature
λ = capacity of Nature, maximum size of Nature in absence of depletion
δ = rate of depletion per worker, who are all commoners. Only commoners produce
Note that αC, αE, CC, and CE are all functions of w, xC, and xE.
In the HANDY model, population is in units of people, nature/wealth are in units of "eco-Dollars", and time is in units of years. "Eco-dollars" are a combination unit created due to the fact that the structure of the model requires nature and wealth to be measured in the same units.
Model Description
The total population is divided between xC and xE, the population of commoners and elites. The population grows through birth rate β and decreases through death rate α. While β is the same for both populations, but α is different since it depends upon wealth. No surprises there.
The equation for the natural resources of nature ẏ = γy(λ - y) - δxCy has a regeneration term γy(λ - y) and a depletion term -δxCy.
The bit (λ - y) in the regeneration term means the regrowth is exponentially huge when y is a tiny fraction of &lambda, but regrowth rapidly slows down as y approaches λ. The maximum rate of regeneration is when y = λ/2.
The depletion term models the reduction in natural resources due to pollution as well as consumption. δ is the rate of depletion per worker, xC is because all workers are commoners. The elites are all in executive, management, and supervisory jobs; they don't actually produce anything. Heaven forfend that they get their hands dirty.
The equation for wealth ẇ = δxCy - CC - CE has wealth increasing with production δxCy, and decreases with the consumption of the commoners and the elites CC and CE.
CONSUMPTION RATES IN HANDY
consumption rates for elites and commoners as a fuction of wealth
right side of graph is normal conditions, as you travel left you get closer to a drop in consumption.
Note that the consumption of the commoners equation CC = min(1, w/wth)sxC means that they are all being paid a bare minimum subsistence salary per capita s. And that is only if there is enough wealth to pay them, that's the min(1, w/wth) part.
The elites pay themselves min(1, w/wth)κsxC, that is, their salary is κ times larger than the subsistence salary the commoners have to make do with. The rich get richer while the poor get poorer, which again is no surprise.
However this does mean that when the wealth becomes too small to support this consumption (w < wth), the elites will suffer a higher rate of death than the commoners. Offsetting that is the fact that even after the commoners start experiencing famine, the priviledged elites will still be consuming at the higher rate κ.
Actually κ represents the factors that determine the division of the output of the total production of society between elites and masses, such as the balance of class power between elites and masses, and the capacity of each group to organize and pursue their economic interests. The HANDY model currently has κ as a constant in each scenario. The study authors are going to explore having it determined exdogenously by other factors in the model.
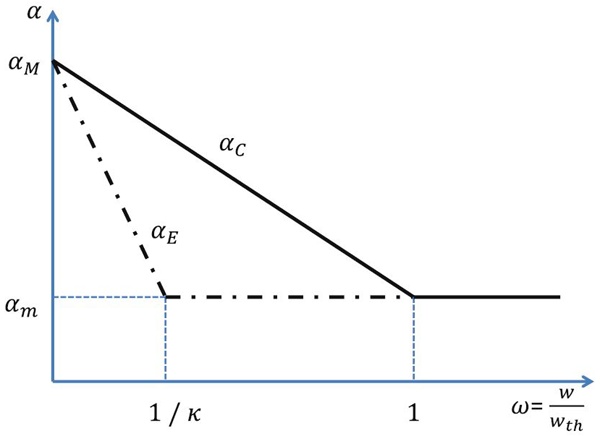
DEATH RATES IN HANDY
right side of graph is normal conditions, as you travel left you get closer to famine
Famine starts when C/sx ≤ 1, and death rate rises from αm toward αM
So commoners start experiencing famine when w/wth ≤ 1
But elites do not have famine until w/wth ≤ 1/κ, the bastards! This delay is due to the elites' unequal access to wealth
However the elites will die off quicker, notice how much steeper the αE line is
The death rates αC = αm + max(0, 1-(C/sx))(αM - αm) vary between a normal heathy value of αm when there is plenty of food, and a maximum famine value of αM when everybody is starving to death. Note that by "famine" the model also means such things as emigration, increased disease susceptibility, breakdowns in social order, banditry, riots, rebellions, revolutions, and wars. Also note that an increase in death rates might actually be a decrease in birth rates. In any event, "famine" means "a reduction in population when it exceeds the environmental carry capacity."
Scenarios
The report studied several scenarios in different types of societies. The society types were:
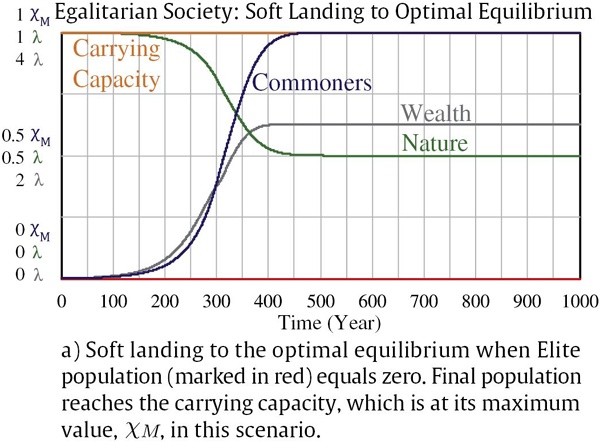
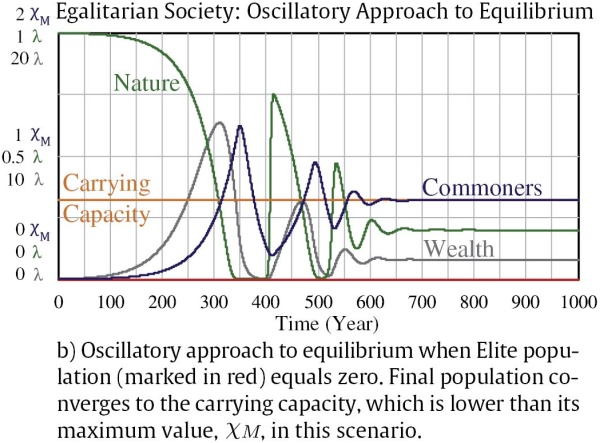
EGALITARIAN SOCIETY: no elites. xE = 0, κ is not used
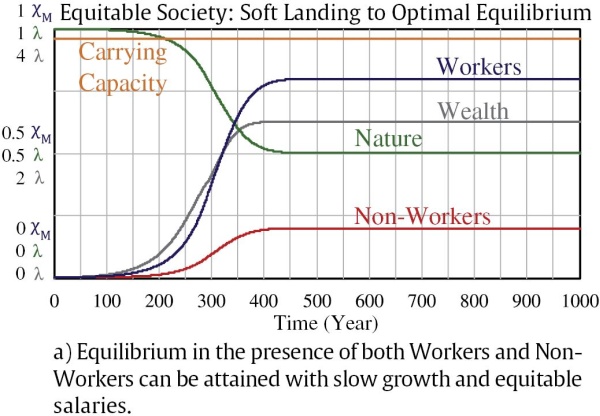
EQUITABLE SOCIETY: there are both elites and commoners. However, the pay is equal. xE ≥ 0 but κ = 1
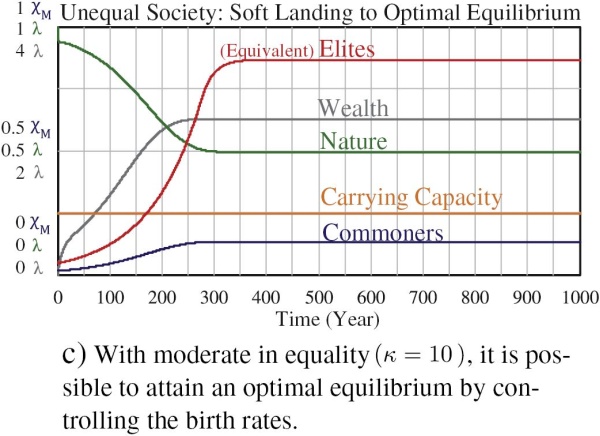
UNEQUAL SOCIETY: the sadly common kind. There are elites, and they get more pay. xE ≥ 0, κ > 1
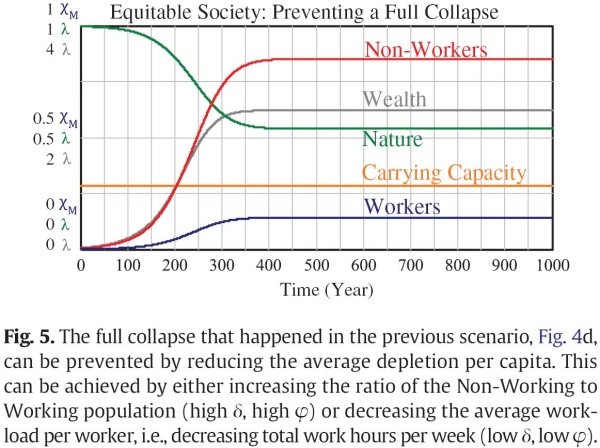
The report found two types of collapses:
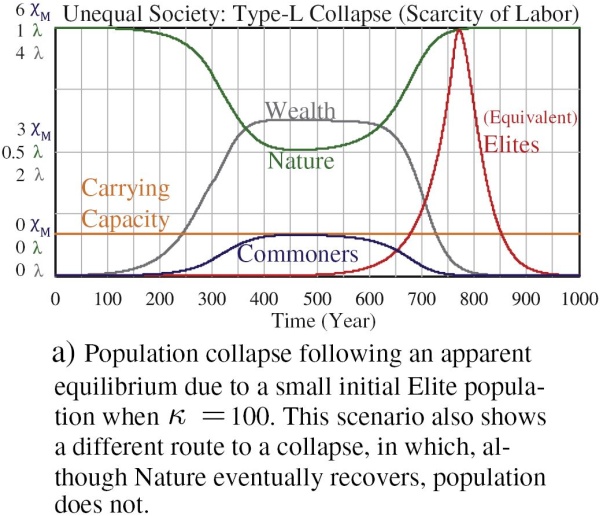
TYPE-L (Disappearance of Labor) collapse due to a scarcity of labor following an inequality-induced famine.
In this type of collapse, the growth of elite population strains the availability of resources for the commoners. This causes a decline of the commoner population. Since the commoners do all the labor and creates all the wealth, there is a decline of wealth. Eventually the wealth declines to the point where the elite population plumets as well.
This type of collapse can only occur in an Unequal Society because the root cause is inequality.
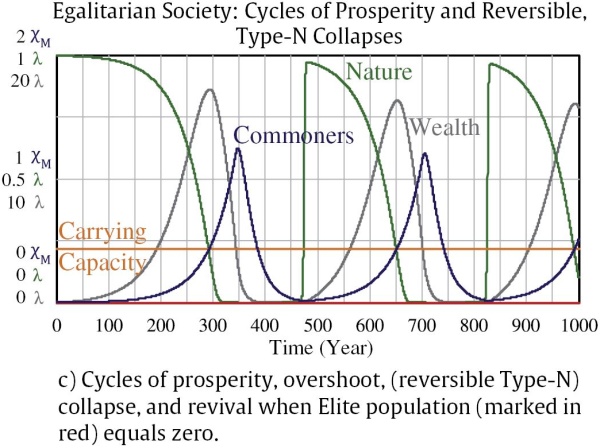
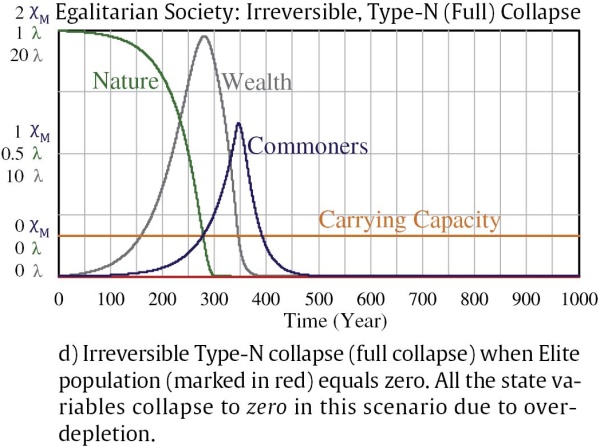
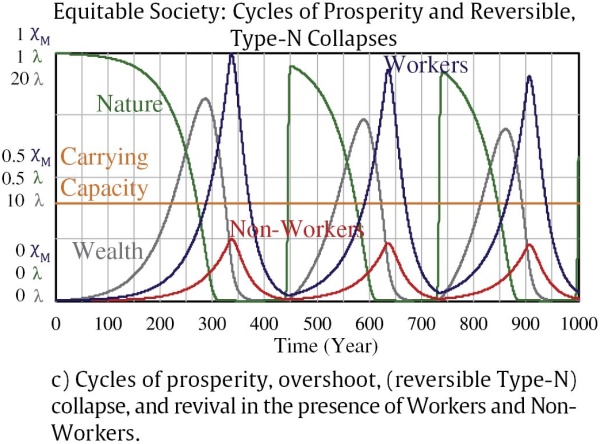
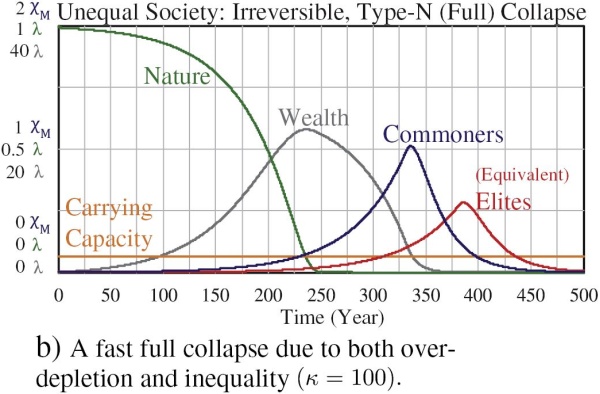
TYPE-N (Exhaustion of Nature) collapse due to a scarcity of Nature, depletion of natural resources.
In this type of collapse, it all starts with an exhaustion of Nature, followed by a decline of Wealth, which causes a decline of the commoner population, and eventually the decline of the elites.
Depending upon the depletion rate, a Type-N can be "reversible" or "irreversible." In the former case, regrowth of nature can trigger another cycle of prosperity. In the latter case, if the depletion is pushed beyond a certain limit, Nature fully collapses and the entire society follows. The paper calls an irreversible Type-N collapse a "full" collapse.
Examples: reversible Type-N, the Greek and Roman collapses. irrevrsible Type-N, Easter Island.
Egalitarian Society
Equitable Society
Unequal Society
Michael Flynn Model
AN INTRODUCTION TO PSYCHOHISTORY PT 1
“We have to be prepared to be surprised by the future, but we don’t have
to be dumbfounded."
Kenneth Boulding
Has the Great West African War already
started‘? How many race riots will the
U.S. experience during the outbreak of
2010 A.D.? How many orbital factories
will go bankrupt during the Recession
of 2033? Is the imminent breakup of
everything together; but researchers in
fields ranging from ecology to differential topology have already laid the
"Foundations. ”
“But the curves, if they meant anything at all, included free will . . .
Every morning three million ‘free wills’
flowed toward the center of the New
York megapolis; every evening they
flowed out again—all by ‘free will,’ and
on a smooth and predictable curve."
Robert A. Heinlein
(“The Year of the Jackpot”)
Psychohistory is an attempt to understand the forces driving human history and to express them in useful
mathematical terms. ln short, to replace
anecdote with analysis. Specifically, we
want to formulate laws regarding: 1) the
internal structures of different societies;
2) their geographical relationships; and
3) their dynamics over time. (Books purporting to psychoanalyze historical figures have been dubbed “psychohistory” by the literati, but this is not the science
we mean here. Psychoanalysis is a religion, not
a science. That is, its premises cannot be proved
false by any objective evidence and must be
accepted on faith.)
This bare statement is enough to trigger cries of outrage. Science is dehunanizing! We need less of it, not more!
Laws of history are impossible because
people have free will! Besides, human
societies are too complex for scientific
analysis!
But are these objections valid? Science is the process of discovering the
material causes of measurable phenomena. As such, it is de-mystifying rather
than de-humanizing. If conditions like
war and poverty have material causes,
they can only be corrected by attacking
those causes, not by “wishing them
away” with good thoughts. At any rate,
as anthropologist Marvin Harris observes, the study of culture is not currently suffering from an overdose of the
scientific method.
As for free will, freedom is the opposite of compulsion, not of causality.
A free choice is not an unreasonable
one. That is, it has reasons—or causes
—that could be summarized in the form
of a law. A scientific law is a description, not a cause, of phenomena. A law
of history could no more compel you
to behave a particular way than an actuarial table compels you to die.
The complexity of human society
only means that laws of history could
be hard to find, not that they don’t exist.
Certainly, many of the examples cited
in this article are simplistic; but “simplistic” needn’t mean “wrong.” Even
a simplified analysis can be illuminating. At this stage, no one expects to
write down a single, all-encompassing
system of differential equations describing every facet of society. After all, the
physicists have yet to solve the general
three-body problem. A mathematical,
scientific approach to culture is just beginning.
Psychohistory is a broad subject, and
we can’t cover it in depth here; but we
can take a look at some of the highlights
of this emerging science.
Scientific laws are statistical laws.
They deal with the overall tendencies
of large groups. Nuclear physics does
not predict the fate of every neutron; nor
organic chemistry“ that of every molecule. In the same way, predicting an
individual’s behavior is a practical impossibility, meaning it is impossible as
a practical matter to identify and measure all the factors that influence it. However, in large groups individual variations
can cancel out, producing regularities
or patterns. Thus, the average behavior
of a group may be predictable, even
though that of the individuals in the
group is not. That’s what keeps casinos
and insurance companies solvent.
Let’s look at a few examples of pattems and regularity:
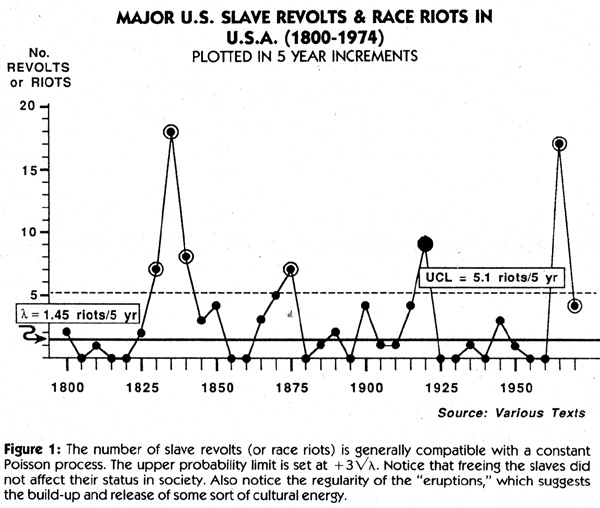
1. U.S. Slave Revolts/Race Riots
have been plotted in five-year increments on a Shewhait quality control
chart (Figure 1). A Shewhart chart is a
statistical tool that distinguishes between random fluctuations, inherent in
the system, and non-random fluctuations, caused by disturbances to the sys-
tem. The dotted line is the upper
probability limit for a stable Poisson
process. This is the same process used
to model the emission of radioactive
particles. We see that the U.S. has
“emitted” riots/slave revolts at the rate
of λ = 0.29 riots/year for the last 170
years. This average is “built into" the
U.S. cultural system. Peaks occur every
other generation. The regularity of these
peaks indicates a second structural cause. (Of course, it's easier to blame the riots
on the rioters. But that's like blaming the thunderstorm on the thunder!)
The persistence of the pattern shows that
Emancipation did not fundamentally
alter the position of blacks in American
society; and (unless the Civil Rights
Movement did change the system) that
we can expect the next peak around
2010 A. D.
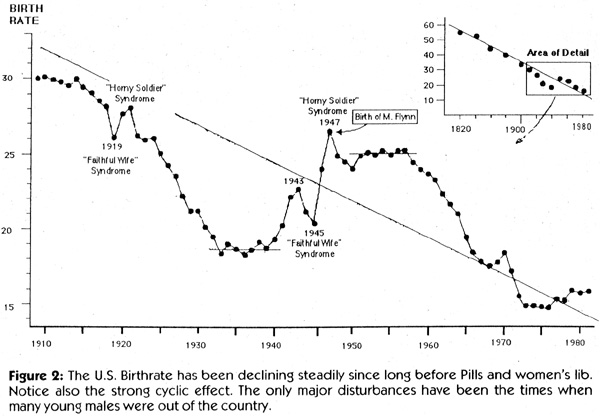
2. U.S. Birth Rates have declined
linearly since at least 1820, with Boom
and Bust cycles snaking their way
around the trendline (Figure 2). The recent “Baby Bust" and the new Baby
Boomlet, signaled by the chart in 1979,
are only a continuation of this trend.
(By the way, notice that the “post war”
Baby Boom started before the war.) The
usual reasons given for declining birth
rates (The Pill, legalized abortion,
women’s lib) cannot explain this pattern. What natural force is at work here?
3. U.S. Homicide Rates have only
recently returned to the peaks achieved
in the 1930s, when executions were
common (Figure 3). Do executions (or
the lack of them) cause the homicide
rate to change? Or do changes in the
homicide rate cause people to demand
executions? Which is the cause; which,
the effect?
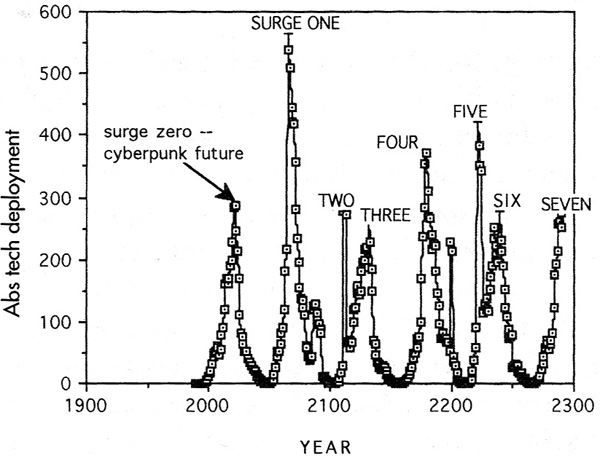
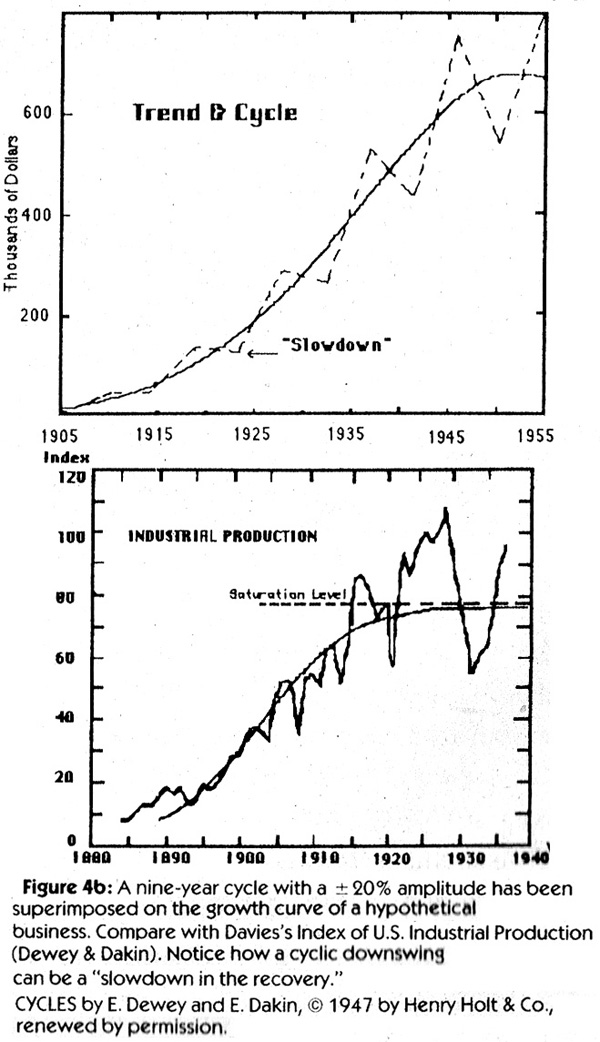
4. U.S. Economic Cycles, plotted
by Dewey and Dakin in 1945, accurately forecast the recent recession,
back on an S-shaped growth curve (Figure 4b). Seemingly chaotic patterns can
often be decomposed into several of
these simpler ones, each being the reflection of a basic law. (The 54-year Kondratieff cycle has been
traced, in British wheat prices, back to 1240
A.D. Obviously, the root cause cannot be the
policies of particular presidents. Yet every time
the economic indicators jump up and down,
so do the Economists as they “explain” The
Cause or, more importantly, Fix the Blame.)
click for larger image
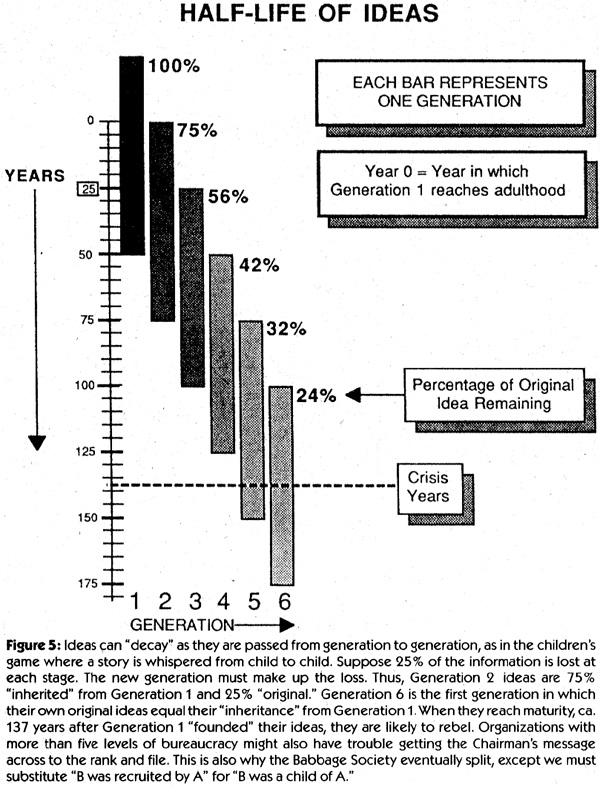
5. Half-life of Ideas. There is often
a lag of five generations (ca. 137 years)
between the establishment of an idea in
a society and the reaction to it (Figure
5). For example, Toynbee noted that the
intelligentsia (created by Peter the Great
in 1689 in imitation of the Western
bourgeoisie) rose up against the Tsar in
the Decembrist revolt of 1825. Similarly, the westernized Committee of
Union and Progress overthrew Sultan
‘Abd-al-Hamid ll in 1908, 134 years
after the Porte began Westernizing Turkey in 1774. The 1629 Charter of the
Massachussets Bay Company established American colonies for the exploitation of the mother country; an idea
that was rejected in the Stamp Act riots
of 1765. The establishment of Orthodox
Christianity as the official church of the
Greek (a.k.a. Roman) Empire in 313
was repudiated in 451, when the Empire’s Syriac-speaking, Monophysite
subjects rejected the Council of Chalcedon.
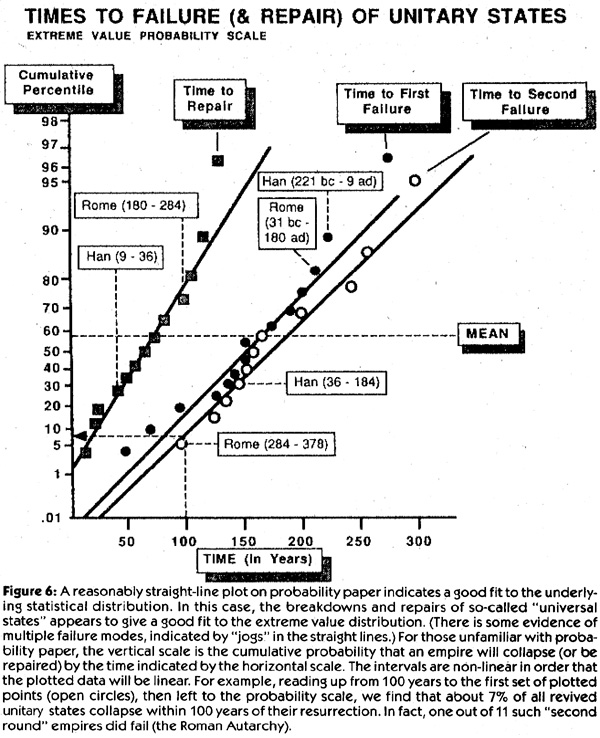
6. Lifetimes of Unitary States are
shown plotted on Extreme Value probability paper (Figure 6). Extreme value
distributions are used to model the
breakdown of complex systems where
failure is of the “weakest link” or
“peak overload” type. Evidently, it
doesn’t matter if the complex system is
electrical, mechanical, or cultural. Empires have a Mean Time Before Failure
(MTBF) of 160 years for the first failure. lt takes an average of 70 years to
“repair” the system (MTTR), which
then survives for an additional MTBF
of 185 years. Of course, there is also
random variation around these averages. What structural factors account for
the characteristic life? For variation
around that life‘?
As these examples indicate, cultural
processes do exhibit “lawful” behavior. The problem, of course, is to discover the law!
History being a branch of the biological sciences, its ultimate expression
must be mathematical.
Colin McEvedy
One approach is to devise mathematical equations linking various factors in the social system. We can
validate such models by “postdicting”.
past events. lf the model simulates Real
World behavior. that is strong evidence
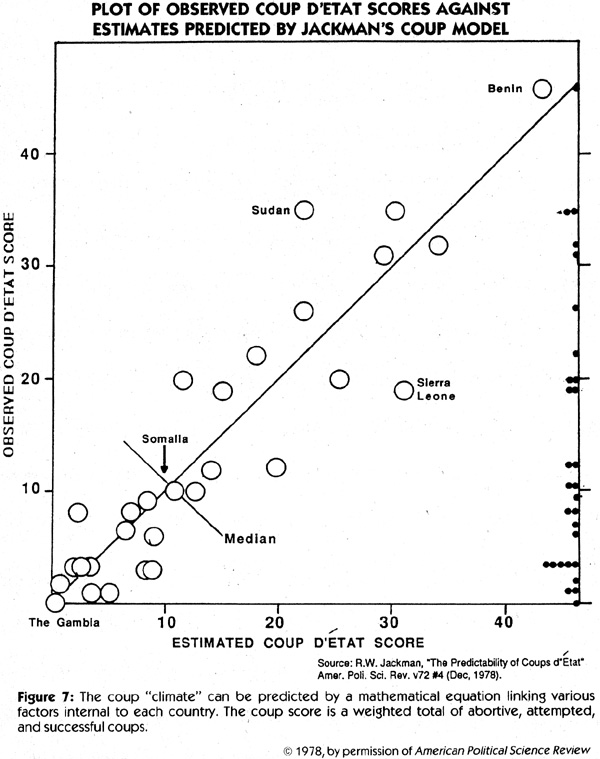
in its favor. For example, political scientist Robert Jackman developed a model
for coups d’état that correlated 92%
with the actual coup frequencies among
Black African states (Figure 7). The
model was based on structural factors
internal to each country, such as the literacy rate and the percentage of the population engaged in non-agricultural work.
Similarly, Jay Forrester’s computer
model of the U.S. economy produced
50+ year “Kondratieff cycles,” just
like the Real World, despite the fact that
Forrester and his team were unaware of
the existence of such cycles when they
constructed the model. The cycles resulted from the linkages between different economic sectors in the model.
Mathematical modeling lets us understand how history works, by turning
our attention away from the symptoms
of individual events and toward the
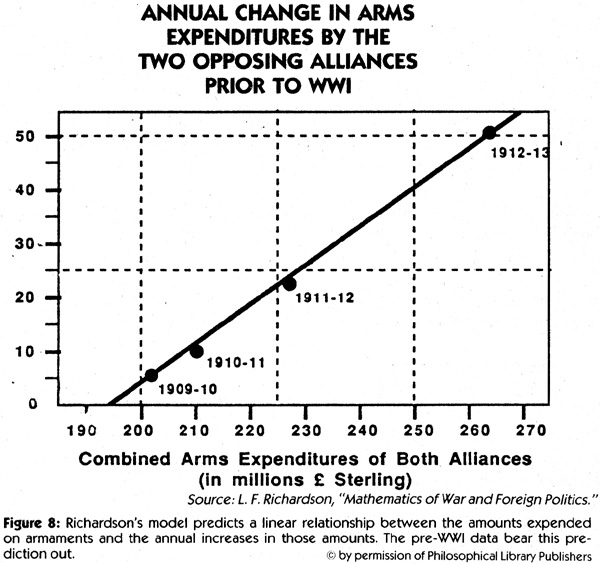
process that produces them. One early
example was Lewis Fry Richardson’s
model of arms races:
Let X and Y be the belligerent behaviors of two coalitions. Each will increase in “defensive reaction” to the
other. But increases will also be
“damped” by economic and other constraints; so that:
dX/dt = axY - bxX + cx
dY/dt = ayX - byY + cy
Using “expenditures on arms” as a
first approximation to X and Y, Richardson reported a good fit to the arms
races that preceded World Wars I and
II (Figure 8). The stability point of this
system (if it exists) is dX/dt = dY/dt
= 0, a bilateral freeze. But notice that
such a freeze cannot be imposed on the
system at any arbitrarily-chosen point
(X,Y). Rather, it occurs naturally at a
particular point determined by the values of the a, b, and c parameters. (Unfortunately, there is no guarantee that
war will not break out before the stability point
is achieved. In fact, if anyone knows of an arms
race that did not end in war, I would be glad
to hear of it!)
In his book, Looking at History
through Mathematics, pioneer psycho-historian Nicholas Rashevsky showed
how the mathematical techniques of the
hard sciences could be applied in principle to such historical processes as village and class formation or the “kinematics of social behavior.”
Transformations: Mathematical Approaches to Cultural Change, edited by
archeologist Colin Renfrew and mathematician Kenneth Cooke, gives many
further examples, including the uses of
topological catastrophe theory, a subject
to which we will return shortly.
Let’s look at some further examples
of modeling:
1) Ecozones. Historian Colin McEvedy has developed a graphical technique for identifying ecozones, regions
that are “attractive” to certain ways of
life. He defined the “littoral ecozone”
in the Mediterranean as follows: First
lay a fine grid over the map and define
coastal squares as those which contain
a segment of coastline. Then color those
land squares, a majority of whose neighbors are coastal. This identifies sites
whose coastal connections outweigh
their inland connections and will, therefore, be attractive to sea-going societies,
such as the Greeks, Carthaginians,
Venetians, or Byzantines. The ecozone
concept may explain why lifestyles and
customs stop spreading even when no
obvious geographical barrier stands in
their way. For example, the distribution
of continental monasteries founded by
lrish monks during the Dark Ages almost exactly matches that of the ancient
Celtic Hallstatt culture. Coincidence or
ecozone?
2) Settlement Formation. ls there
a general process that explains how settlements are sited? If there is, it may tell
us something about the success of projected lunar or orbital colonies. Robert
Rosen has studied this problem. Starting
with an abstract landscape and a function, α, defining the population density
at each coordinate, he postulated two
“forces” at work: 1) a preference for
sites of lower population density, and
2) an affinity (ρ) for sites providing positive reinforcement (such as access to
fertile soil, Broadway theatres, or interstellar wormholes.) McEvedy’s ecozones are examples of affinity functions.
Both of these forces define gradients on
the landscape: one tending to clump the
population around “attractive” sites,
the other tending to disperse the population uniformly, in a kind of cultural
“heat death. ” When combined with the
birth-death process, these assumptions
produce the same formula that describes
a chemical diffusion-reaction process,
namely:
(Sorry! I promise not to do that too often.
But this is the main reason "soft" scientists resist
the very notion of a science of history!)
Isn’t it intriguing how often the
same—or similar—equations appear in
widely different contexts?
3. Topological Networks. The settlements generated bythe above processes form the nodes of a topological
network. The nodes with the highest
connectivity are likely candidates for
capital cities. Georgrapher Forrest R.
Pitts studied the connectivity of medieval Russian towns (which lie, of course,
in the riparian ecozone). Moscow ranked
second; nearby Kolumna, first. The
older capital, Vladimir, was also in this
region. Topologically, Petrograd was an
unnatural, “un-Russian” aberration.
Similarly, all the major capitals of Mesopotamia (Kish, Agade. Babylon, Ctesiphon, Seleucia, and Baghdad) are
closely clustered. Only briefly was Iraq
ruled from outside this small region.
(Usually from Iran, and even the Achaemenid Shahs preferred Babylon to Persepolis.) A topological analysis of intemal
commodity movements reveals the startling fact that there are four (or possibly
five) Indias (cf. Ekistics, by C. A. Doxiadis). These are regions of relatively
high population density and industrialization separated by areas of subsistence
agriculture, and may represent the future political boundaries of the subcontinent.
4. Cultural Interaction. Geographers have found through empirical
studies that the amount of traffic (and
other forms of communication) flowing
between two sites is best described by:
which they blandly call a “gravity
model.” Mass is a function of population and wealth, while distance is the
time and energy needed to travel between the two sites. (This concept of “cultural distance" explains why High Earth Orbit is "halfway to anywhere" in the solar system. Half the ΔV is
neededjust to get that far!)
Using “nearest
neighbor” analysis of Aztec-era settlements in the Valley of Mexico and the
known political boundaries, archeologist John Alden derived an empirical
value of k = 1.9. (Close enough to the inverse square law
to cause some serious head-scratching among
you physicists out there!)
He then used the
model to “postdict" the unknown political boundaries of Toltec-era states.
We can use the same model to determine
cultural “potential fields,” including
“natural” political and economic
boundaries.
Applied to New York City, for example, we find that the “cultural boundaries” with Boston and Philadelphia lie
just short of Providence and Trenton,
respectively. At Easton, PA, New York
City is nearly-three times more “attractive” than Philadelphia. (Some of you may be puzzled by the use
of "attractive" and "New York City" in the same
sentence. But, then, a black hole is attractive,
too.)
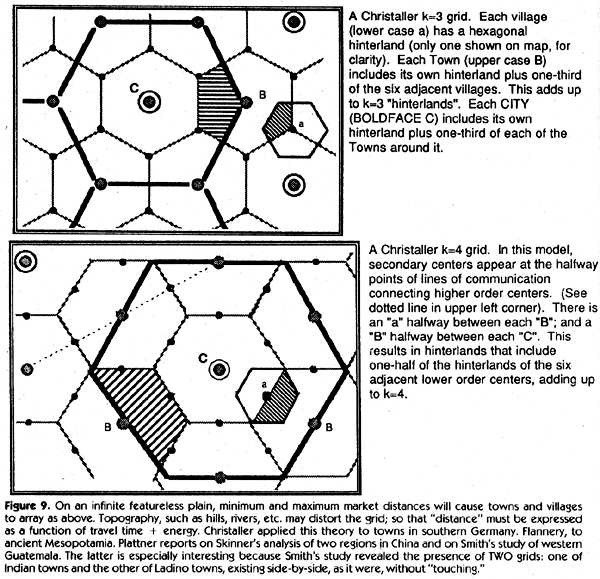
5. Central Place Theory. Villages
cannot supply every possible service.
Goods offered for sale have minimum
and maximum ranges, based on the distances people are willing to travel to buy
(or sell) them. This gives rise to a hierarchy of central places (market towns)
that, on an idealized landscape, forms
a lattice of inter-penetrating hexagons
called Christaller grids (Figure 9). Central Place Theory, first proposed by the
German geographer Walter Christaller
in the 1930s and further elaborated by
August Lésch, predicts the geographic
distribution of central places and the
hierarchical relationships among them.
It may also explain the placement of
services within modern cities: Why
some are scattered about (eg. gas stations), while others are concentrated
(e.g. Wall Street), and still others are
handled by itinerant “circuit-riders”
(e.g. visiting consultants) or periodic
markets (eg. Tupperware(r) parties). Many
centrally-planned economic reforms fail
because they unwittingly work against
these natural forces. This has profound
implications for Third World development.
distance = travel time + energy is a similar concept to "action distance"
“These things are so bizarre that I cannot bear to contemplate them.”
Henri Poincaré
There are three fundamental axioms
of psychohistory:
a) Human societies are homeostatic
systems. They are subject to general
system laws, of which the laws of physical, biological, and cultural systems
are localizations.
Smith
b) Human societies are biological
populations. They are subject to ecological laws regarding production and
reproduction." especially the production
of food and other forms of energy.
Malthus
c) The causes cultural institutions
are material, not mystical.
Marx
These are modern restatements derived from what these three gentlemen
originally wrote. lt may seem odd to list
Adam Smith, Thomas Malthus, and
Karl Marx as co-founders of anything.
Ma‘rx, for example, called Malthus a
“baboon in parson’s clothing” and the
level of debate in the social sciences has
changed very little since then. (Neither
has the mutual animosity among capitalists, environmentalists, and socialists.) But, despite their respective
shortcomings, all three did try to use the
scientific method. ln fact, Marx’s pronouncement that cultural phenomena
have material causes amounts to a simple statement that cultures can be analyzed scientifically! A scientist cannot
“explain” a custom like Hindu cow
love by calling it a religious duty. He
must discover natural, material reasons
why it became a religious duty in the
first place.
A homeostatic system is one that
“seeks” an equilibrium. Mathematically, we say that the system is “governed by a potential function.” A society
is attracted so strongly toward its equilibrium that, even when it is disturbed,
it will return to its former trajectory once
the disturbance is removed (Figure 10).
The set of equilibrium points is called
the attractor of the system. Some attractors are fixed points, like the rest
point of a pendulum; others are simple
orbits, like the business cycle. However, in complex systems, we must deal
with so-called “strange attractors" whose
topology is not so simple. The climate,
for example, is the strange attractor of
the weather. (Strange attractors have nothing to do
with the people you meet in singles bars.)
Rashevsky developed a mathematical
model for the “kinematics of social behavior,” based upon psychological
stimulus-response theory (making him
truly a psycho-historian). The model
predicts the number, location, and stability of the equilibrium levels; that is,
the fraction of the population that will
ultimately “exhibit the behavior.”
When we see (hear or read about) a
new behavior we are stimulated to imitate it. The strength of the stimulus
depends upon three factors: X, the number of doers (“Mom! Everyone is doing
itl"), Ax the persuasive (or coercive)
resources of the doers (“C’mon! What
are ya, chicken‘?”), and A, the population’s innate willingness to imitate.
(We won’t worry for now how to measure those last two!)
Imagine a behavior B advocated by
Xo, a group of “partisans.” Another
group, Yo, advocates not-B. The remainder choose either B or not-B as the
spirit moves them. According to Rashevsky’s model, the equilibrium level is
determined by the “coercion/imitation”
ratio (AxXo - AyYo)/A. When this ratio
exceeds a critical value, C*, a majority
of the society will eventually adopt B.
lf it is less than -C*, a majority will
adopt not-B. lf it falls in between ±C*,
then B and not-B are both potential equilibria. That is, the society would be attracted toward both levels; and identical
conditions could cause different behavior in different societies!
Theoretically, given the number of
partisans for each candidate, plus some
measure of their ability to reach and
persuade voters, Rashevsky’s model
could forecast the outcomes of elections. Provided, that is, that the elections were free and were always held
after the equilibrium was reached! Unfortunately, the latter isn’t always the
case. The equilibrium level itself can
change before the system reaches it! The
equilibrium is determined by the parameters of the system; and the parameters themselves are variables.
Imagine a ball bearing drawn toward
a magnet. Very simple laws will describe its trajectory and predict its resting place. But what if the magnet itself
is moving‘? The ball’s trajectory is no
longer so simple. Cultural dynamics is
like that. Imagine the dynamics of a
solar system in which the gravitational
constant and planetary masses were
changing! (Hmmmm.)
Usually, small parametric changes
result in small changes in the equilibrium; but not always. Sometimes a small
parametric change can cause a large,
sudden change in behavior. For exam-
ple, as a rubber band is stretched, it
grows incrementally longer—until it
passes through a singularity and snaps,
a behavior utterly unpredictable by extrapolating its past growth. Societies can
snap, too. Revolutions, coups, fads,
economic booms & busts, technological
breakthroughs. Sudden change often interrupts the path toward equilibrium
(Figure ll).
Perhaps the most dramatic such
changes have been the collapse of certain state-level societies, whose complex structures simplified rapidly into
chiefdoms or even tribes. The collapses
of the Mayan and Aegean societies were
the most complete of such collapses; but
the Egyptian society after the Vl Dynasty or the Graeco-Roman society in
Westem Europe are also well-known
examples. Could it happen here? There
are also cases of equally-sudden complexification: e.g. the formation of the
Saxon and Zulu kingdoms or of the Iroquois Confederacy. A smaller scale
example is the collapse of passenger
railroads in the U.S. Passenger miles
increased and decreased in sudden “exponential epochs." What are the causes
of sudden change?
We usually blame sudden change on
exogenous factors: barbarian invaders,
communist subversives, outside agitators, the CIA, and the like. The change
is “forced” on the society by external
forces. However, topological catastrophe theory, developed by René Thom,
has shown that sudden change can result
from endogenous factors, internal to the
society (cf. Ian Stewart, “What Shape
is a Catastrophe?” Analog, June, 1978).
The roots of sudden change lie in the
fact that, as in Rashevsky’s model of
social behavior, there are sometimes
two (or more!) equilibrium levels for the
same parameter values. We can visualize this situation by means of a “catastrophe surface.”
For simplicity, imagine that there are
two parameters (the “control variables”). These define a plane called the
parameter space. (Even in very complex situations, a relatively few control
variables determine the bulk of the actual behavior.) Also suppose that there
is one state variable, represented by a
potential function, and express this as
vertical distance above the parameter
plane. For each point in parameter space
there is one (or more) equilibrium state.
The set of all equilibrium points forms
a manifold that sits over the parameter
space. This is the “catastrophe surface.” Thom’s theory states that there
are only seven “elementary” surfaces.
For two control variables and one state
variable, that surface is called the Cusp,
a sheet with a pleat, or fold, in it. Let’s
look at two simple examples.
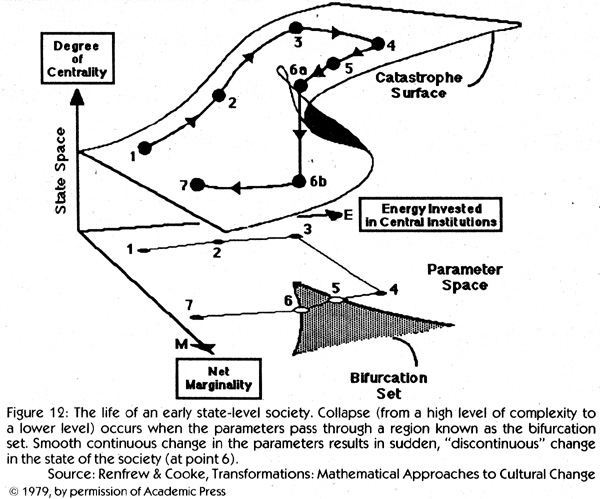
1. Collapse of State-level Societies:
Archaeologist Colin Renfrew developed
a cusp surface to describe the sudden
collapse of early agricultural societies.
The two control variables were E, the
energy assigned to cultural devices used
to promote adherence to the central authority; and M, the margin between productivity and taxes. The state variable
is C, the “degree of centrality,” which
is some measure of the information carrying capacity of the society ( No, the model is not E = MC2. That
would have been cute, though ).
Archaeologically, C is indicated by a Christaller
grid of central places, the maintenance
of bureaucratic records, flags and insignia, and so on. Let’s follow the trajectory of a typical society in Figure l2.
An egalitarian, tribal society (1), intensifies production through the urgings
of so-called “big men,” and invests the
surplus in the trappings of central au-
thority (2). “Big men” become
“chiefs,” then “kings.” Complexity
increases until the State appears (3).
However, population growth eventually
compresses production. lt is no longer
so easy to increase the per capita yield
enough to support the central authority.
The society is under stress (4). As E
decreases slightly, the society enters a
region of the parameter space called the
“bifurcation set” (5). ln this region,
there are two equilibrium levels for
which social efficiency is maximized.
However, inertia (caused by the time
lags or “viscosity” of the system) keeps
the society on the upper fold of the pleat
(6a). Then, as the society leaves the
bifurcation set, the local maximum van-
ishes, and it is now attracted only by
the lower sheet (6b). The society “falls”
off the‘ edge of the fold. The drop will
not, of course, be instantaneous, but it
will be exponential.
Renfrew went on to add two more
control variables (kinship and extemal
threat), producing the multi-dimensional Butterfly Catastrophe, whose hypersuiface contains a pocket. The pocket
in this example corresponds to stable
chiefdoms, a level of social complexity
partway between tribal and state organizations.)
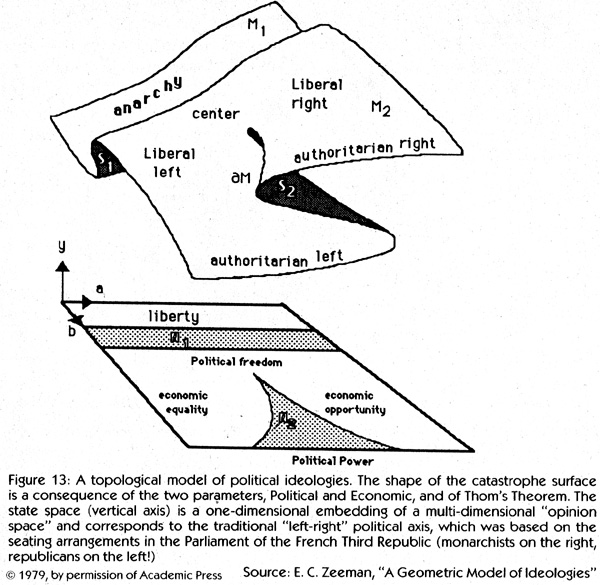
2. Political Ideologies: E. C. Zeeman developed a cusp model of political
ideologies. The two parameters, A and
B, were economic (opportunity versus
equality) and political (the rights of the
individuals versus the rights of the
group). The state space was a “cloud
of points” representing the opinions of
the individuals in the society. (These are
measurable, at least in theory, by opinion polling.) The cloud was embedded
topologically in a one-dimensional space,
Y, which turned out to be the traditional
left-to-right political spectrum. Zeeman‘s catastrophe surface shows why
this simple line really has a complex
“anatomy” (Figure 13).
Projecting the
surface onto the AY and BY planes reveals why dictatorships of the left and
the right resemble each other so closely,
and why right-wing populists often
sound like left-wingers. It also shows
why some social changes must be revolutionary; and why one-party states frequently develop left and right wings
within the Party.
We have seen that cultural processes
are, at least in principle, susceptible to
mathematical analysis and modeling.
Far from being inappropriate, the tools
of the hard sciences can have great util-
ity here. Not the least benefit would be
the translation of cultural theories into
rigorous testable format, something now
usually lacking in the “soft” sciences.
However, even the most sophisticated mathematics is sterile. We must
also have a theory to support it. That
brings us to the other two Basic Axioms,
the subject of Part II.
“About twenty." Yamashita pointed to the clock on the
board, it was calibrated to Venus’ seventy-two hour day.
“It's around one hundred thirty kilometers to the camp,
so we should just about make it by sunset."
“That isn’t very fast," said Hollister. “Why not fly, or
at least build roads?’
“The aircraft are all needed for speed travel and
impassable terrain, and the roads will come later," said
Yamashita. “These tanks can go it all right—most of the
time."
“But why have the camp so far from the city?”
“It’s the best location from a supply standpoint. We get
most of our food from Little Moscow, and water from
Hellfire, and chemicals from New America and Roger’s
Landing. The cities more or less specialize, you know.
They have to: there isn’t enough iron ore and whatnot
handy to any one spot to build a city big enough to do
everything by itself. So the air camps are set up at points
which minimize the total distance over which supplies
have to be hauled."
“You mean action distance, don't you? The product of
the energy and time required for hauling.” ("time required for hauling" goes up as the ground becomes more rugged. It takes less time to haul along a road than it does across a swamp.)
Yamashita nodded, with a new respect in his eyes.
“You’ll do," he said.
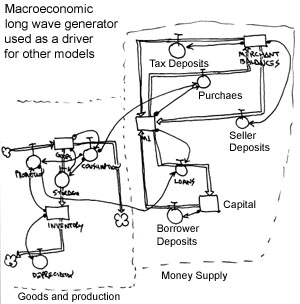
I have an unhelpful note I wrote in the early 1980's that shows a tiny bit of a macroeconomic model created by Dr. Barnes using an ancient icon-based software package called STELLA (Systems Thinking Experiential Learning Laboratory) for the early Apple Macintosh. (STELLA is from Isee Systems, formerly High Performance Systems. It is quite expensive.) The note is unhelpful since I appear to have neglected to write down the magazine it was published in. The diagram shows a "Macroeconomic model long-wave generator, used as a driver for other models", and includes cryptic icons with names like Merchant Balances, Seller Deposits, Production, Consumption, Inventory, Depreciation, and other things. If anybody knows where this magazine article came from, please send me an email. (William Seney suggests that it was an issue of MacWorld, and that does ring a bell. Now to find what issue it was.)
Software
STELLA
The way I'd create a history generator is to develop a computer program that was some species of 4X computer game. These games have the primary goals of eXplore, eXpand, eXploit and eXterminate. The best known example is Sid Meier's Civilization.
So you would start with a star map of your SF universe, set up mathematical models for population growth, types of government and mechanisms for governmental change, technological advancement, interstellar transit times, colonization techniques, interstellar war and conquest, revolutionary colonies splitting from the parent empire, and interrelations between these factors. Begin with an initial population on planet Earth with however many nations you care to track, start the program, then relax with your favorite beverage as you watch it crank out your future history.
Obviously much easier said than done.
Metrics
Before you can start making mathematical models, you have to settle on metrics to quantify the various factors. Here are some examples:
For nations, the state of the citizen's well-being can be measured by the Human Development Index. This factors in life expectancy, literacy, education, and standard of living into one number. Among other things it can indicate whether a country is a developed, developing, or underdeveloped country.
The economic Misery index is found by adding the unemployment rate to the inflation rate. This tends to predict the relative crime rate of one year in the future.
The Gini coefficient is a measure of inequality of a distribution of income. If the difference in income between the rich and the poor becomes too absurdly large, the society becomes increasingly unstable. Historians often point to a large Gini coefficient and the disappearance of the middle class as two of the warning signs of the downfall of the Roman empire.
The above three metrics were suggested by Stephen Rider.
Jerry Pournelle's Political Axis and the Inglehart-Welzel Cultural Map of the World have possibilities. Each nation would have a ranting in the two values used in each graph, and as the values changed so would the nation's classification. For instance, on the Pournelle chart, if the government of Zeta Reticuli II had a Rationalism rating of 4' and a Statism rating of 3.5, it would be in the Socialist classification and would make decisions using whatever you programmed for that classification. If for whatever reason its Rationalism rating dropped to 3.5', it would change to Welfare Liberal classification with corresponding changes in its decision making process.
There are some equations for modeling interstellar colonization here.
There are tons of equations for modeling interstellar trade in the classic book GURPS Traveller: Far Trader.
A book over-flowing with useful equations for modeling geopolitical situations is Chris Crawford's BALANCE OF POWER International Politics as the Ultimate Global Game(Microsoft Press 1986, ISBN 0-914845-97-7, do NOT make the mistake of ordering the game manual as it has no equations). In the book, Mr. Crawford discusses the mechanisms inside his eponymous award-winning computer game. The book is out of print but copies can be found at Bookfinder.com.
Stephen Rider is mulling over the factors involved with such a program:
After looking at a few generation systems/empire modeling games, I know that I need to at least look at the following: I know it's a lot of points that more research is needed on all of them, but please let me know if any of them are truly whacked.
1) the movement of populations between systems. emigration and immigration normally are determined randomly, but if I have the computational power to actually figure out how people will move, then we should do that as...
2) political allegiance is something that needs to be at least looked at, at the moment I'm thinking of a system that'd start with the major planet (say Earth) and then create a hierarchy of settled planets, much like a tree structure, but if population flows got mixed in, it could create strange balances.
3) economic loyalty - this 'theoretically' would allow worlds that were growing fast economically to become the center of their own mini empire economically, if too many worlds became economic power houses, then it wouldn't work. If you saw a map of trade density, it would look like mountain peaks with the peaks being the major economic players that swept allow smaller worlds. When the simulation end period came along, this could be one of the major ways that the factions were determined.
4) Political priorities - life path problems. Kinda getting back to the idea that each colony will need to come up with their own character, colonies would start with an archetype (not sure how to do this, but it'd be a function of looking at the initial reason for building the colony, money input and world climate/world traits) and then within that framework have random events that could happen based on planet and who colonized it. This would generate a set of planetary traits, such as idealism, pragmatism, greed, environmentalism et al that would effect the options available to the government when problems turned up. For example, a Three Generations Rule problem might be very easy for a highly pragmatic colony to deal with, while one that was high in idealism might run into problems. Yes, in a sense this is trying to ascribe in a half dozen variables a political/social culture...maybe impossible.
5) Political groups - no planet will have just one political faction, this should also help complicate problem solving because not everyone will see a problem as a problem per see.
6) economic investments - infrastructure has to grow and the simplest way to determine how to choose what to invest in is by being able to calculate the cash flows. Assuming that a nominal risk free interest rate can be set, it does become possible to discount cash flows and determine if building that super big star port is really a good idea at the time, or if it's not such a hot idea, which brings us to...
[assuming that investment outside of the planet's solar system is also being looked at the process each turn would be to calculate all the investment opportunities for each planet, combine them, rank them by ROI and then allocate resources to the best one and work your way down the list until you ran out of investment money]
7) what is the rest of the economy doing? you're not going to be investing 100% of a worlds income, so what will the rest of it be doing? More research needed
8) random fluctuations and results are going to be common, a new star port terminal or whatever may have an expected to reduce the planetary movement cost by $50 or so such, but it will be more variable than that, sometimes engineers get things wrong and sometimes they get things really right. This is another dynamic designed to prevent the cookie cutter feel of planets from such things as Masters of Orion II where past a certain point you just knew you wanted to build everything.
9) Transfer costs, this is an assessment of how hard it is to get into the solar system from a planet/economic point (asteroids will have basically zero while heavy gravity worlds will have very high costs), this also applies between systems. This put together with manufacturing costs will set the minim price for off world goods, and yes if I could figure out how to run a supply and demand economy, that's the first thing I'll try to set up.
10) tech level - this will be a sliding scale that will set the availability and constructability of planetary assets and define part of the manufacturing costs of a given sector. Looking at how 2300's Great Game II set it up, it'll be a function of literacy, college education and urbanization, it doesn't have to be a nice number (meaning 13.451 is a valid tech level). It's all evolutionary technology so there won't be any major break troughs, just making it better.
11) Human Development Index/Misery Index will also be part of what makes a planet, if for no other reason than to generate a push for immigration/emigration. I almost get the feeling that you could model population movement between to planets by looking at the indexes and trying to balance them out as a physics problem with gases under pressure.
Stephen Rider
Balance of Power
Here are some of the equations from Chris Crawford's BALANCE OF POWER International Politics as the Ultimate Global Game(Microsoft Press 1986, ISBN 0-914845-97-7). You should read the book for the theory behind the equations. The game pits the USA player vs the Soviet player in a geopolitical fight for world domination.
Please note that the equations were for a game, not a simulation. Also note that due to game development constraints, many factors were left out of the game. These include the influence of trade (trade restrictions, trade barriers, trade boycotts, trade embargoes), multipolarity (in the game there is a bipolar situation between the US and the Soviet Union, and all other nations are allied with one or the other. Things get more complicated if there are more than two superpowers), warfare between two minor powers (in the game all wars have at least one and sometimes two superpowers involved), arms control, and human rights.
Due to technical details of computer programming, the equations use values of 0 to 255 instead of 0 to 100, and values of -127 to +127 instead of values of -100 to +100. For arcane reasons any programmer can explain to you, this gives better accuracy in the calculations. And due to the limits of the computer (Apple Macintosh), he used 16-bit signed integers, which means all the numbers range between -32,767 and +32,767. Any calculations that yield a result outside of this range will make the equations act crazy. For similar reasons some of the equations need odd numbers like 256 and 2048, they too are due to the limits of the computer.
Governments vs. Internal Insurgencies
An insurgency is an armed attempt by native elements acting outside the
government to overthrow the government or repudiate its control over a region.
It is characterized by a protracted campaign between the armed forces of the state
and those of the insurgency. An insurgency is differentiated from a coup d’etat by
the facts that a coup is a very sudden event and one that often involves persons
working from within the machinery of the government.
Three primary ingredients are necessary to cook up an insurgency. First, you
must have a government or other legitimate authority against whom the
insurgency is directed. After all, you can’t have a rebellion against no one!
Second, you must have the insurgents themselves: the people who rebel against
the government. Third, the insurgents must be willing to use armed force against
the government. The element of armed force is not necessary to ensure success
(witness Mohandas Gandhi), but without it you have civil disobedience or a coup
d’état, not an insurgency.
Balance of Power must calculate the behavior of the insurgency in each country of
the world. This means that it must first calculate the strength of the insurgency
and the strength of the government forces. It must then determine how these two
forces fare in combat with each other. Then it must determine the significance of
this outcome, such as whether the insurgency has graduated to the status of a
civil war. Finally, the program must compute the consequences of an insurgency
victory on the makeup of the government and its relationships with the
superpowers.
Soldiers = number of solders the government has in its army
Weapons = amount of government money spent on weapons
MilitaryAid = amount of money for weapons a government receives from a superpower
GovernmentPower = net military power resulting from soldiers and weapons
InterventionPower = military power provided to government by any intervening superpower troops
Note the balance between soldiers and weapons. If, for instance, you have vastly more soldiers than weapons, adding more soldiers does little to increase government power. Adding more weapons has a much stronger effect.
Chris Crawford's national maturity ratings for 1980
InsurgentSuccess = how successful the insurgents were last year when battling the government
sqrt(x) = square root of x
LastYearInsurgencyPower = the value for InsurgencyPower last year
LastYearGovernmentPower = the value for GovernmentPower last year
Fighters = number of fighters in the insurgency "army"
Maturity = 0-255, a measure of the stability of a nation's cultural and governmental institutions. As an example, sub-Saharan African nations have low maturity metrics, and tend to be caught in endless cycles of violence. In the game these were constants, but in a longer term simulation they will be variable. The longer the period of stability, the higher the maturity value will grow.
The constants 6400, 256, and 20480 are intended to scale things to the 0-255 metric of Maturity.
In the game, Chris Crawford "intuitively selected" the following sample maturity values for the various nations in the year 1980. These appear in the table to the right. In 2014 he noted that given his now 30 years of hindsight, he'd make quite a few changes in those maturity values.
The above is an exceedingly simplistic method of combat resolution, feel free to substitute something more complicated. Mr. Crawford was writing a game about geopolitics, not a war game. The equations basically say that each side can inflict damage on their opponent's power equal to one quarter of their strength.
InsurgencyRatio is calculated, and the new state of affairs in that country is looked up in the table on the right
In the game, the two players take the parts of superpowers The United States and The Soviet Union. The players give aid to key nations, giving to either the government or insurgents of a nation trying to influence the outcome. The players give (if anything) for MilitaryAid, WeaponsShipmentsFromSuperpowers, and/or InterventionPower for each nation's government or insurgency.
In the game, one player is a human being while the other is a simplistic program algorithm trying to give the human a run for their money. For our history generator the program will have to somehow make the decisions for both sides. The program influenced by the current ideology of the superpower in question.
If The Insurgents Win
The insurgents become the new government. If they had help from a superpower (i.e., any MilitaryAid, WeaponsShipmentsFromSuperpowers, and/or InterventionPower) the new government (former insurgents) will modify their left-wing/right-wing stance to be more like the helper superpower.
GovernmentWing = Political leaning of the government. -128 = extreme left-wing. +128 = extreme right-wing. 0 = moderates. Note: it would be interesting to somehow replace this one-dimensional metric with a two-dimensional one like Jerry Pournelle's Political Axis or the Inglehart-Welzel Cultural Map HelperSuperpowerGovernmentWing = Political leaning of the superpower that helped the insurgency. USA = +20. Soviet Union = -80.
abs(x) = Absolute value of x (i.e., make any negative values into positive)
Popularity = popularity of the government. This is used in figuring the likelihood of a coup d'etat (see below). The equation above gives a new "blank slate" popularity for a new government.
The new government's diplomatic relation with the two superpowers are calculated. The following equations are calculated for both superpowers in turn.
PoliticalCompatibility = used in the DiplomaticAffinity equation
GovernmentWing = Political leaning of the new government/former insurgents
FormerGovernmentWing = Political leaning of the deposed former government
SuperpowerWing = Political leaning of the superpower in question
WeaponShipmentToFormerInsurgents = total WeaponsShipmentsFromSuperpowers to the former insurgents from the superpower in question
InterventionForFormerInsurgents = total InterventionPower to the former insurgents from the superpower in question
WeaponShipmentToFormerGovernment = total WeaponsShipmentsFromSuperpowers to the deposed former government from the superpower in question
InterventionForFormerInsurgents = total InterventionPower to the deposed former government from the superpower in question
As previously mentioned, the above equations are calculated for both superpowers. Naturally if a superpower gave lots of help to the deposed former government, the former insurgents/new government will hate that superpower (i.e., have a low DiplomaticAffinity). In the game, changes in DiplomaticAffinity add to or subtract from each superpower's Prestige Points, which help determine which superpower "wins" the game. This is probably worthless in our history generator. There are some elements of insurgencies that the above equations fail to take into account, for details read the book.
Coup d'etat
A Coup d'etat, unlike an insurgency, only changes the executive. The rest of the government remains intact. Coups also tend to be much less violent than a revolution. In some cases a coup might be an integral part of a government system, for example an election. Since economics plays such a large role in a coup, the economic equation from BALANCE OF POWER will also be presented here.
ConsumerPressure = pressure the government feels to increase consumer spending at the expense of investment spending and military spending.
InvestmentPressure = pressure the government feels to increase investment spending at the expense of consumer spending and military spending.
MilitaryPressure = pressure the government feels to increase military spending at the expense of consumer spending and investment spending.
GovernmentPopularity = measure of the popularity of the government, generally between 1 and 20
InvestmentFraction = fraction of the total GNP that was spend on investment (new roads, schools, factories, etc). Range is 0 to 255 where 0 = 0% and 255 = 100%
InsurgencyStrengthRatio = ratio of insurgency strength to government strength.
USA_FinlandizationProb, SovietFindlandizationProb = degree to which the government feels vulnerable to and threatened by the two superpowers.
GovernmentPopularity term on the right represents the loyalty of the masses.
Improvement term is how much the masses life situation has improved due
to government action
GovernmentWing term assumes that radical governments (both left and right wing) have an advantage over centrist governments. This is due to how radical governments suppress dissent, and the divisiveness that often cripples centrist governments.
-3 term assumes that the masses expect a 3% consumer spending growth rate
IF GovernmentPopularity < (USA_Destabilzation + SovietDestabilization) THEN Trigger a Coup
USA_Destabilzation, SovietDestabilization = level of superpower attempts to trigger a coup, ranges from 0 to 5 Generally the superpower destabilization will be zero, so it reduces to a coup being triggered if the GovernmentPopularity becomes negative.
If A Coup Is Triggered
GovernmentWing = GovernmentWing * -1
Right Wing becomes Left Wing, and vice versa
GovernmentPopularity = a randomly selected positive number
People have an optimistic expectation of the new government
Soldiers = Soldiers * (a randomly selected percentage)
TotalWeapons = TotalWeapons * (a randomly selected percentage)
Soldiers do not fight as well when they do not know who they are fighting for.
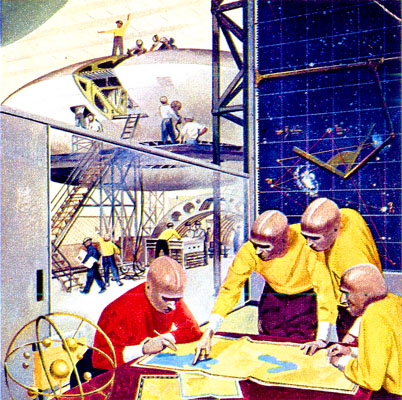


 There was a (sadly defunct) game company called Game Designer's Workshop. For their hard-SF role playing game 2300 AD, they needed a future history. So they simulated it with a game, the so-called "Great Game." A team of expert players was each assigned one nation and the game was played until the time reached 2300 AD. The events that occurred were recorded, and became the future history.